Travelers 2006 Annual Report Download - page 95
Download and view the complete annual report
Please find page 95 of the 2006 Travelers annual report below. You can navigate through the pages in the report by either clicking on the pages listed below, or by using the keyword search tool below to find specific information within the annual report.-
 1
1 -
2
-
3
-
4
-
5
-
6
-
7
-
8
-
9
-
10
-
11
-
12
-
13
-
14
-
15
-
16
-
17
-
18
-
19
-
20
-
21
-
22
-
23
-
24
-
25
-
26
-
27
-
28
-
29
-
30
-
31
-
32
-
33
-
34
-
35
-
36
-
37
-
38
-
39
-
40
-
41
-
42
-
43
-
44
-
45
-
46
-
47
-
48
-
49
-
50
-
51
-
52
-
53
-
54
-
55
-
56
-
57
-
58
-
59
-
60
-
61
-
62
-
63
-
64
-
65
-
66
-
67
-
68
-
69
-
70
-
71
-
72
-
73
-
74
-
75
-
76
-
77
-
78
-
79
-
80
-
81
-
82
-
83
-
84
-
 85
85 -
 86
86 -
 87
87 -
 88
88 -
 89
89 -
 90
90 -
 91
91 -
 92
92 -
 93
93 -
 94
94 -
 95
95 -
 96
96 -
 97
97 -
 98
98 -
 99
99 -
 100
100 -
 101
101 -
 102
102 -
 103
103 -
 104
104 -
 105
105 -
106
-
107
-
108
-
109
-
110
-
111
-
112
-
113
-
114
-
115
-
116
-
117
-
118
-
119
-
120
-
121
-
122
-
123
-
124
-
125
-
126
-
127
-
128
-
129
-
130
-
131
-
132
-
133
-
134
-
135
-
136
-
137
-
138
-
139
-
140
-
141
-
142
-
143
-
144
-
145
-
146
-
147
-
148
-
149
-
150
-
151
-
152
-
153
-
154
-
155
-
156
-
157
-
158
-
159
-
160
-
161
-
162
-
163
-
164
-
165
-
166
-
167
-
168
-
169
-
170
-
171
-
172
-
173
-
174
-
175
-
176
-
177
-
178
-
179
-
180
-
181
-
182
-
183
-
184
-
185
-
186
-
187
-
188
-
189
-
190
-
191
-
192
-
193
-
194
-
195
-
196
-
197
-
198
-
199
-
200
-
201
-
202
-
203
-
204
-
205
-
206
-
207
-
208
-
209
-
210
-
211
-
212
-
213
-
214
-
215
-
216
-
217
-
218
-
219
-
220
-
221
-
222
-
223
-
224
-
225
-
226
-
227
-
228
-
229
-
230
-
231
-
232
-
233
-
234
-
235
-
236
-
237
-
238
-
239
-
240
-
241
-
242
-
243
-
244
-
245
-
246
-
247
-
248
-
249
-
250
-
251
-
252
-
253
-
254
-
255
-
256
-
257
-
258
-
259
-
260
-
261
-
262
-
263
-
264
-
265
-
266
-
267
-
268
-
269
-
270
-
271
-
272
-
273
-
274
-
275
-
276
-
277
-
278
-
279
-
280
-
281
-
282
-
283
-
284
-
285
 |
 |
83
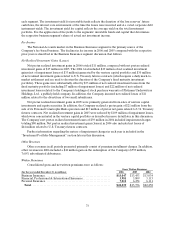
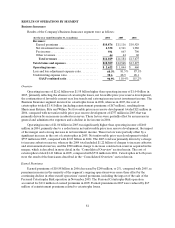
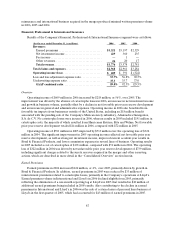
Claims and claim adjustment expenses in 2005 of $9.36billion declinedfrom the 2004 total of $9.84
billion. Included in those totals were $1.32 billion and $532 million, respectively, of catastrophe losses (net
of reinsurance). Net unfavorable prior year reserve development totaled $757 million in 2005, as described
above. Net unfavorable prior year reserve development totaled $2.03 billion in 2004, which included a $928
million charge tostrengthen asbestos reserves, a $290 million charge to strengthen environmental reserves
and the $500 million charge to increase constructionreserves acquired in the merger described in the
“Consolidated Overview” section herein. Also included in the net unfavorable prior year reserve
developmentin2004 was a $174 million addition to the reserve for uncollectible reinsurance recoverables,
$150 million recorded in TPC’s Construction operation prior to the merger, $74 million from the
commutation of agreements with a major reinsurer and other net unfavorable prior year reserve
development, primarily concentrated in the Company’s Gulf operations. Results in 2004 also reflected
increased current year loss ratios on portions of the Construction book of business. Partially offsetting the
impact of these factors was favorable prior year reserve development in several core Business Insurance
operations, which resulted from reductions in the frequency of non-catastrophe related losses attributable
to improved underwriting and pricing strategies in prior years, the results of which emerged in 2004.
Approximately half of the$155 million 2006 pre-tax increase to asbestos reserves was due to an
increase in the projected defense costs for ten policyholders. Additionally, $15 million of the pretax reserve
adjustment was attributable to a delay in the approval and expected payment of the previously announced
settlement with PPG Industries, Inc. as part of the Pittsburgh Corning bankruptcy reorganization plan. The
remainder of the reserve adjustment was primarily due to continued litigation activity against smaller,
peripheral defendants. In 2005, the asbestos charge resulted, in part, from higher than expected defense
costs due to increased trial activity for seriously impaired plaintiffs and prolonged litigation before cases
are settled or dismissed. The 2005 charge also considered the January 2006 court decision voiding, on
procedural grounds, the previously rendered favorable arbitration decision in the ongoing ACandS
litigation. The asbestos charge recordedin 2004 primarily resulted from an increase in litigation costs and
activity surrounding peripheral defendants. The $120 million environmental reserve addition in 2006 was
primarily due to higher than expected defense and settlement costs. In 2005, the environmental reserve
charge was primarily related to declaratory judgment costs, whereas the significant 2004 charge was related
to revised estimates of costs related tosettlement initiatives. See the “Asbestos Claims and Litigation” and
“Environmental Claims and Litigation” sections herein for further discussion of these reserves.
General and administrative expenses in 2006 totaled $2.10 billion, 3% higher than the comparable
total of $2.04billion in 2005. The increase in 2006primarily reflected the segment’s expenditures to
support business growth and product development, the segment’s share of costs associated with the
Company’s national advertising campaign and legal expenses related to investigations of various business
practices by certain governmental agencies. General and administrative expenses in 2005 were 4% higher
than the 2004 total of $1.95 billion, which primarily reflected the impact of the merger. The 2004 total
included merger-related charges and an increase in the allowance for uncollectible amounts duefrom
policyholders.
GAAP Combined Ratio
The loss and loss adjustment expense ratio in 2006 of 60.3% improved by 21.2 points compared with
the 2005 ratio of 81.5%, primarily due to the absence of catastrophe losses and net favorable prior year
reserve development in 2006 (versus net unfavorable prior year reservedevelopment in 2005). Catastrophe
losses accounted for 12.3 points of the 2005 loss and loss adjustment expense ratio. Net favorable prior
year reserve developmentin 2006 provided a 0.2 point benefit to the loss and loss adjustment expense
ratio, whereas net unfavorable prior year reserve development in 2005 accounted for 6.8 points of the loss
and loss adjustment expense ratio. The 2006 loss and loss adjustment expense ratio excluding catastrophe
losses and prior year reserve development improved over the2005 ratio on the same basis, reflecting
improvement in frequency and severity trends in several lines of business.