Travelers 2006 Annual Report Download - page 120
Download and view the complete annual report
Please find page 120 of the 2006 Travelers annual report below. You can navigate through the pages in the report by either clicking on the pages listed below, or by using the keyword search tool below to find specific information within the annual report.-
 1
1 -
2
-
3
-
4
-
5
-
6
-
7
-
8
-
9
-
10
-
11
-
12
-
13
-
14
-
15
-
16
-
17
-
18
-
19
-
20
-
21
-
22
-
23
-
24
-
25
-
26
-
27
-
28
-
29
-
30
-
31
-
32
-
33
-
34
-
35
-
36
-
37
-
38
-
39
-
40
-
41
-
42
-
43
-
44
-
45
-
46
-
47
-
48
-
49
-
50
-
51
-
52
-
53
-
54
-
55
-
56
-
57
-
58
-
59
-
60
-
61
-
62
-
63
-
64
-
65
-
66
-
67
-
68
-
69
-
70
-
71
-
72
-
73
-
74
-
75
-
76
-
77
-
78
-
79
-
80
-
81
-
82
-
83
-
84
-
85
-
86
-
87
-
88
-
89
-
90
-
91
-
92
-
93
-
94
-
95
-
96
-
97
-
98
-
99
-
100
-
101
-
102
-
103
-
104
-
105
-
106
-
107
-
108
-
109
-
 110
110 -
 111
111 -
 112
112 -
 113
113 -
 114
114 -
 115
115 -
 116
116 -
 117
117 -
 118
118 -
 119
119 -
 120
120 -
 121
121 -
 122
122 -
 123
123 -
 124
124 -
 125
125 -
 126
126 -
 127
127 -
 128
128 -
 129
129 -
 130
130 -
131
-
132
-
133
-
134
-
135
-
136
-
137
-
138
-
139
-
140
-
141
-
142
-
143
-
144
-
145
-
146
-
147
-
148
-
149
-
150
-
151
-
152
-
153
-
154
-
155
-
156
-
157
-
158
-
159
-
160
-
161
-
162
-
163
-
164
-
165
-
166
-
167
-
168
-
169
-
170
-
171
-
172
-
173
-
174
-
175
-
176
-
177
-
178
-
179
-
180
-
181
-
182
-
183
-
184
-
185
-
186
-
187
-
188
-
189
-
190
-
191
-
192
-
193
-
194
-
195
-
196
-
197
-
198
-
199
-
200
-
201
-
202
-
203
-
204
-
205
-
206
-
207
-
208
-
209
-
210
-
211
-
212
-
213
-
214
-
215
-
216
-
217
-
218
-
219
-
220
-
221
-
222
-
223
-
224
-
225
-
226
-
227
-
228
-
229
-
230
-
231
-
232
-
233
-
234
-
235
-
236
-
237
-
238
-
239
-
240
-
241
-
242
-
243
-
244
-
245
-
246
-
247
-
248
-
249
-
250
-
251
-
252
-
253
-
254
-
255
-
256
-
257
-
258
-
259
-
260
-
261
-
262
-
263
-
264
-
265
-
266
-
267
-
268
-
269
-
270
-
271
-
272
-
273
-
274
-
275
-
276
-
277
-
278
-
279
-
280
-
281
-
282
-
283
-
284
-
285
 |
 |
108
with the Securities and Exchange Commission and its $1 billion line of credit. Cash provided fromthese
sources is used primarily for claims and claim adjustment expense payments and operating expenses. The
timing and amount of catastrophe claims are inherently unpredictable. Such claims increase liquidity
requirements. The timing and amount of reinsurance recoveries may be affected by reinsurer solvency and
reinsurance coverage disputes. Additionally, the variability of asbestos-related claim payments, as well as
the volatility of potential judgments and settlements arising outof litigation, may also result in increased
liquidity requirements. It is the opinion of the Company’s management that the Company’s future liquidity
needs will be adequately met from all of the above sources.
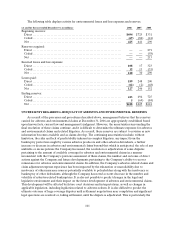
Operating Activities
Net cash flows provided by operating activities of continuing operations totaled $4.77 billion, $3.59
billion and $5.07 billion in 2006, 2005 and2004, respectively. Cash flows in 2006reflected higher levels of
collected premiums and net investment income, lower claim payments on catastrophe losses, as well as
lower runoff claim payments. In addition, cash flows from operations in 2006 benefited from significant
2006 reinsurance recoveries related to 2005 hurricane losses, operations in runoff (primarily Gulf) and
various commutation agreements. These factors were partially offset by higher interest payments and an
increase in tax payments resulting from higher profitability. Cash flows in 2005 reflected an increase in loss
and loss adjustment expense payments primarily related to the catastrophe losses incurred during 2005 and
2004, and an increase in tax payments resulting from higher profitability. Cash flows in 2004 included $867
million in cash proceeds received pursuant to the commutation of specific reinsurance agreements. Cash
flows in 2004also benefited from premium rate and volume increases. The Company utilized $11 million,
$2.00 billion and $548 million of net operating loss (NOL) carryforwards during 2006, 2005 and 2004,
respectively, thereby reducing current regular tax payments by $4 million, $698 million and $192 million,
respectively.
Net cash flows provided by operating activities for all three years were negatively impacted by
payments for asbestos andenvironmental liabilities, as well as by payments for claims related to the
Company’s runoff operations.
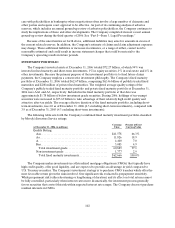
Investing Activities
Net cash flows used in investing activities of continuing operations totaled $3.06 billion, $5.44 billion
and $4.65 billion in 2006, 2005 and2004, respectively. Fixed maturity securities accounted for themajority
of investment purchases in all three years.
The majority of funds available for investment are deployed in a widely diversified portfolio of high
quality, liquid intermediate-term taxable U.S. government, corporate- and mortgage-backed bonds and
tax-exempt U.S. municipal bonds. The Company closely monitors the duration of its fixed maturity
investments, and investment purchases and sales are executed with the objective of having adequate funds
available to satisfy the Company’s insurance and debt obligations. The Company’s management of the
duration of the fixed income investmentportfolio generally produces a duration that exceeds the duration
of the Company’s net insurance liabilities. The average duration of fixed maturities and short-term
securities was 4.0 at December 31, 2006, compared with 3.9 at December 31, 2005.
The Company also invests much smaller amounts in equity securities, venture capital, real estate,
private equity limited partnerships, joint ventures, other limited partnerships and trading securities. These
investment classes have the potential for higher returns but also involve varying degrees of risk, including
less stable rates of return and less liquidity.
The primary goals of the Company’s asset liability management process are to satisfy the insurance
liabilities, manage the interest rate risk embedded in those insurance liabilities, and maintain sufficient
liquidity to cover fluctuations in projected liability cash flows. Generally, the expected principal and