Travelers 2006 Annual Report Download - page 192
Download and view the complete annual report
Please find page 192 of the 2006 Travelers annual report below. You can navigate through the pages in the report by either clicking on the pages listed below, or by using the keyword search tool below to find specific information within the annual report.-
 1
1 -
2
-
3
-
4
-
5
-
6
-
7
-
8
-
9
-
10
-
11
-
12
-
13
-
14
-
15
-
16
-
17
-
18
-
19
-
20
-
21
-
22
-
23
-
24
-
25
-
26
-
27
-
28
-
29
-
30
-
31
-
32
-
33
-
34
-
35
-
36
-
37
-
38
-
39
-
40
-
41
-
42
-
43
-
44
-
45
-
46
-
47
-
48
-
49
-
50
-
51
-
52
-
53
-
54
-
55
-
56
-
57
-
58
-
59
-
60
-
61
-
62
-
63
-
64
-
65
-
66
-
67
-
68
-
69
-
70
-
71
-
72
-
73
-
74
-
75
-
76
-
77
-
78
-
79
-
80
-
81
-
82
-
83
-
84
-
85
-
86
-
87
-
88
-
89
-
90
-
91
-
92
-
93
-
94
-
95
-
96
-
97
-
98
-
99
-
100
-
101
-
102
-
103
-
104
-
105
-
106
-
107
-
108
-
109
-
110
-
111
-
112
-
113
-
114
-
115
-
116
-
117
-
118
-
119
-
120
-
121
-
122
-
123
-
124
-
125
-
126
-
127
-
128
-
129
-
130
-
131
-
132
-
133
-
134
-
135
-
136
-
137
-
138
-
139
-
140
-
141
-
142
-
143
-
144
-
145
-
146
-
147
-
148
-
149
-
150
-
151
-
152
-
153
-
154
-
155
-
156
-
157
-
158
-
159
-
160
-
161
-
162
-
163
-
164
-
165
-
166
-
167
-
168
-
169
-
170
-
171
-
172
-
173
-
174
-
175
-
176
-
177
-
178
-
179
-
180
-
181
-
 182
182 -
 183
183 -
 184
184 -
 185
185 -
 186
186 -
 187
187 -
 188
188 -
 189
189 -
 190
190 -
 191
191 -
 192
192 -
 193
193 -
 194
194 -
 195
195 -
 196
196 -
 197
197 -
 198
198 -
 199
199 -
 200
200 -
 201
201 -
 202
202 -
203
-
204
-
205
-
206
-
207
-
208
-
209
-
210
-
211
-
212
-
213
-
214
-
215
-
216
-
217
-
218
-
219
-
220
-
221
-
222
-
223
-
224
-
225
-
226
-
227
-
228
-
229
-
230
-
231
-
232
-
233
-
234
-
235
-
236
-
237
-
238
-
239
-
240
-
241
-
242
-
243
-
244
-
245
-
246
-
247
-
248
-
249
-
250
-
251
-
252
-
253
-
254
-
255
-
256
-
257
-
258
-
259
-
260
-
261
-
262
-
263
-
264
-
265
-
266
-
267
-
268
-
269
-
270
-
271
-
272
-
273
-
274
-
275
-
276
-
277
-
278
-
279
-
280
-
281
-
282
-
283
-
284
-
285
 |
 |

THE TRAVELERS COMPANIES, INC. AND SUBSIDIARIES
NOTES TO CONSOLIDATED FINANCIAL STATEMENTS (Continued)
180
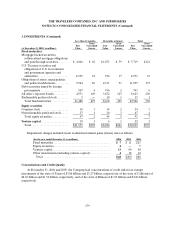
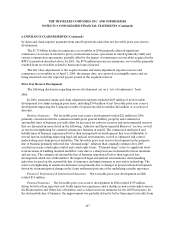
3. INVESTMENTS (Continued)
Included in fixed maturities are below investment grade assets totaling $1.78 billion and $1.75 billion
at December 31, 2006 and 2005, respectively. The Company defines its below investment grade assets as
those securities rated below investmentgrade by external rating agencies, or the equivalent by the
Company’s investment advisors when a public rating does not exist. Such assets includepublicly traded
below investment grade bonds and certain other privately issued bonds that are classified as below
investment grade loans.
The Company monitors creditworthiness of counterparties to financial instruments by using controls
that include credit approvals, limits and other monitoring procedures.
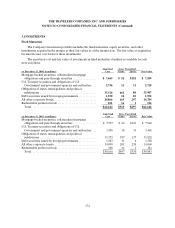
Net Investment Income
(for the year ended December 31, in millions) 2006 2005 200 4
Gross investment income
Fixed maturities..................................... $2,738 $2,530 $2,128
Equity securities. .................................... 30 41 47
Short-term securities................................. 285 182 70
Real estate......................................... 46 58 67
Other investments................................... 481 427 456
Gross investment income........................... 3,580 3,238 2,768
Investment expenses ................................. 63 73 105
Net investment income. ............................ $3,517 $3,165 $2,663
Net Realized and Unrealized Investment Gains (Losses)
Net realized investment gains (losses) for theperiods were as follows:
(for the year ended December 31, in millions) 20062005 200 4
Net realized investment gains (losses)
Fixed maturities......................................... $(33) $ —
$ 51
Equity securities. ........................................ 21 34 23
Venture capital. ......................................... 49 (4 ) 5
Other investments (excluding venture capital)............... (26) (13 ) (118)
Net realized investment gains (losses) .................... $ 11 $ 17 $(39 )