Travelers 2006 Annual Report Download - page 31
Download and view the complete annual report
Please find page 31 of the 2006 Travelers annual report below. You can navigate through the pages in the report by either clicking on the pages listed below, or by using the keyword search tool below to find specific information within the annual report.-
 1
1 -
2
-
3
-
4
-
5
-
6
-
7
-
8
-
9
-
10
-
11
-
12
-
13
-
14
-
15
-
16
-
17
-
18
-
19
-
20
-
 21
21 -
 22
22 -
 23
23 -
 24
24 -
 25
25 -
 26
26 -
 27
27 -
 28
28 -
 29
29 -
 30
30 -
 31
31 -
 32
32 -
 33
33 -
 34
34 -
 35
35 -
 36
36 -
 37
37 -
 38
38 -
 39
39 -
 40
40 -
 41
41 -
42
-
43
-
44
-
45
-
46
-
47
-
48
-
49
-
50
-
51
-
52
-
53
-
54
-
55
-
56
-
57
-
58
-
59
-
60
-
61
-
62
-
63
-
64
-
65
-
66
-
67
-
68
-
69
-
70
-
71
-
72
-
73
-
74
-
75
-
76
-
77
-
78
-
79
-
80
-
81
-
82
-
83
-
84
-
85
-
86
-
87
-
88
-
89
-
90
-
91
-
92
-
93
-
94
-
95
-
96
-
97
-
98
-
99
-
100
-
101
-
102
-
103
-
104
-
105
-
106
-
107
-
108
-
109
-
110
-
111
-
112
-
113
-
114
-
115
-
116
-
117
-
118
-
119
-
120
-
121
-
122
-
123
-
124
-
125
-
126
-
127
-
128
-
129
-
130
-
131
-
132
-
133
-
134
-
135
-
136
-
137
-
138
-
139
-
140
-
141
-
142
-
143
-
144
-
145
-
146
-
147
-
148
-
149
-
150
-
151
-
152
-
153
-
154
-
155
-
156
-
157
-
158
-
159
-
160
-
161
-
162
-
163
-
164
-
165
-
166
-
167
-
168
-
169
-
170
-
171
-
172
-
173
-
174
-
175
-
176
-
177
-
178
-
179
-
180
-
181
-
182
-
183
-
184
-
185
-
186
-
187
-
188
-
189
-
190
-
191
-
192
-
193
-
194
-
195
-
196
-
197
-
198
-
199
-
200
-
201
-
202
-
203
-
204
-
205
-
206
-
207
-
208
-
209
-
210
-
211
-
212
-
213
-
214
-
215
-
216
-
217
-
218
-
219
-
220
-
221
-
222
-
223
-
224
-
225
-
226
-
227
-
228
-
229
-
230
-
231
-
232
-
233
-
234
-
235
-
236
-
237
-
238
-
239
-
240
-
241
-
242
-
243
-
244
-
245
-
246
-
247
-
248
-
249
-
250
-
251
-
252
-
253
-
254
-
255
-
256
-
257
-
258
-
259
-
260
-
261
-
262
-
263
-
264
-
265
-
266
-
267
-
268
-
269
-
270
-
271
-
272
-
273
-
274
-
275
-
276
-
277
-
278
-
279
-
280
-
281
-
282
-
283
-
284
-
285
 |
 |

19
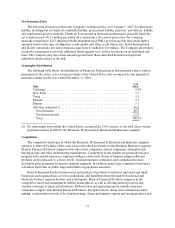
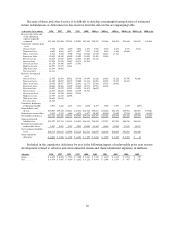
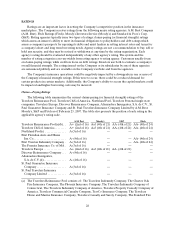
Geographic Distribution
The following table shows the distribution of Personal Insurance’s direct written premiums for the
states that accounted for the majority of premium volume for the year ended December 31, 2006:
State
% of
Total
New York ........................................................... 15.4%
Texas............................................................... 9.3
Pennsylvania ......................................................... 7.1
Massachusetts........................................................ 6.4
Florida.............................................................. 6.1
New Jersey .......................................................... 6.1
Georgia............................................................. 4.6
Virginia ............................................................. 4.5
Connecticut. ......................................................... 4.5
California........................................................... 4.2
Maryland............................................................ 3.2
All Others(1)........................................................ 28.6
Total ............................................................. 100.0%
(1) No other single state accounted for 3.0% or more of the total direct written premiums written in 2006
by the Personal Insurance segment.
Competition
Personal lines insurance is written by hundreds of insurance companies of varying sizes. Although
national companies write the majority of the business, Personal Insurance also faces competition from
local and regional companies which often have a competitive advantage because of their knowledge of the
local marketplace and their relationship with local agents. Personal Insurance believes that the principal
competitive factors are price, service, perceived stability of the insurerand name recognition. Personal
Insurance competes for business within each independent agency since these agencies also offer policies of
competing companies. At the agency level, competition is primarily based on price and the level of service,
including claims handling, as well as the level of automation and the development of long-term
relationships with individual agents. Personal Insurance also competes with insurance companies that use
exclusive agents or salaried employees to sell their products. In addition to its traditional independent
agency distribution, Personal Insurance has broadened its distribution of products by marketing to
sponsoring organizations, including employee and affinity groups, and through joint marketing
arrangements with other insurers. Personal Insurance believes that its continued focus on underwriting and
pricing segmentation, claim settlement effectiveness strategies and expense management practices enable
Personal Insurance to price its products competitively in all of its distribution channels.
CLAIMS MANAGEMENT
The Company’s claims management strategies, together with its focus on optimizing claim outcomes,
cost efficiency and service are critical to the Company’s ability to grow profitably and reflect these core
tenets:
•fair, efficient, fact-based claims management processes;
•use of advanced technology provides front-line claim professionals with necessary information and
facilitates prompt claim resolution;