Travelers 2006 Annual Report Download - page 279
Download and view the complete annual report
Please find page 279 of the 2006 Travelers annual report below. You can navigate through the pages in the report by either clicking on the pages listed below, or by using the keyword search tool below to find specific information within the annual report.-
 1
1 -
2
-
3
-
4
-
5
-
6
-
7
-
8
-
9
-
10
-
11
-
12
-
13
-
14
-
15
-
16
-
17
-
18
-
19
-
20
-
21
-
22
-
23
-
24
-
25
-
26
-
27
-
28
-
29
-
30
-
31
-
32
-
33
-
34
-
35
-
36
-
37
-
38
-
39
-
40
-
41
-
42
-
43
-
44
-
45
-
46
-
47
-
48
-
49
-
50
-
51
-
52
-
53
-
54
-
55
-
56
-
57
-
58
-
59
-
60
-
61
-
62
-
63
-
64
-
65
-
66
-
67
-
68
-
69
-
70
-
71
-
72
-
73
-
74
-
75
-
76
-
77
-
78
-
79
-
80
-
81
-
82
-
83
-
84
-
85
-
86
-
87
-
88
-
89
-
90
-
91
-
92
-
93
-
94
-
95
-
96
-
97
-
98
-
99
-
100
-
101
-
102
-
103
-
104
-
105
-
106
-
107
-
108
-
109
-
110
-
111
-
112
-
113
-
114
-
115
-
116
-
117
-
118
-
119
-
120
-
121
-
122
-
123
-
124
-
125
-
126
-
127
-
128
-
129
-
130
-
131
-
132
-
133
-
134
-
135
-
136
-
137
-
138
-
139
-
140
-
141
-
142
-
143
-
144
-
145
-
146
-
147
-
148
-
149
-
150
-
151
-
152
-
153
-
154
-
155
-
156
-
157
-
158
-
159
-
160
-
161
-
162
-
163
-
164
-
165
-
166
-
167
-
168
-
169
-
170
-
171
-
172
-
173
-
174
-
175
-
176
-
177
-
178
-
179
-
180
-
181
-
182
-
183
-
184
-
185
-
186
-
187
-
188
-
189
-
190
-
191
-
192
-
193
-
194
-
195
-
196
-
197
-
198
-
199
-
200
-
201
-
202
-
203
-
204
-
205
-
206
-
207
-
208
-
209
-
210
-
211
-
212
-
213
-
214
-
215
-
216
-
217
-
218
-
219
-
220
-
221
-
222
-
223
-
224
-
225
-
226
-
227
-
228
-
229
-
230
-
231
-
232
-
233
-
234
-
235
-
236
-
237
-
238
-
239
-
240
-
241
-
242
-
243
-
244
-
245
-
246
-
247
-
248
-
249
-
250
-
251
-
252
-
253
-
254
-
255
-
256
-
257
-
258
-
259
-
260
-
261
-
262
-
263
-
264
-
265
-
266
-
267
-
268
-
 269
269 -
 270
270 -
 271
271 -
 272
272 -
 273
273 -
 274
274 -
 275
275 -
 276
276 -
 277
277 -
 278
278 -
 279
279 -
 280
280 -
 281
281 -
 282
282 -
 283
283 -
 284
284 -
 285
285
 |
 |

Exhibit 12.1
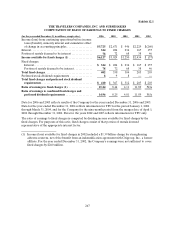
THE TRAVELERS COMPANIES, INC. AND SUBSIDIARIES
COMPUTATION OF RATIO OF EARNINGS TO FIXED CHARGES
(for the yearended December 31, in millions, except ratios)2006 2005 2004 2003 2002
Income (loss) from continuing operations before income
taxes (benefit), minority interest and cumulative effect
of change in accountingprinciples.................. $5,725 $2,671 $946 $ 2,229 $(260)
Interest............................................ 324 286 236 167 157
Portion of rentals deemed to be interest............... 78 72 68 38 46
Income available for fixed charges (1) ................. $6,127 $3,029 $1,250 $ 2 ,434 $ (57)
Fixedcharges:
Interest.......................................... $324 $286 $236 $ 167 $ 157
Portion of rentals deemed to be interest............. 78 72 68 38 46
Total fixed charges.................................. 402 358 304 205 203
Preferredstock dividend requirements................ 8
9 8 — —
Total fixed charges and preferred stock dividend
requirements..................................... $410 $367 $312 $ 205 $ 203
Ratio of earnings to fixed charges (1).................. 15.24 8.46 4.11 11.89 N/A
Ratio of earnings to combined fixed charges and
preferred dividend requirements ................... 14.96 8.25 4.01 11.89 N/A
Data for 2006 and 2005 reflects results of the Company for the years ended December 31, 2006and 2005.
Data for the year ended December 31, 2004 reflects information for TPC for the period January 1, 2004
through March 31, 2004, andfor the Company for the nine-month period from the merger date of April 1,
2004 through December 31, 2004. Data for the years 2002 and 2003 reflects information for TPC only.
The ratio of earnings to fixed charges is computed by dividing income available for fixed charges by the
fixed charges. For purposes of this ratio, fixed charges consist of that portion of rentals deemed
representative of the appropriate interest factor.
(1) Income (loss) available for fixed charges in 2002 included a $1.39 billion charge for strengthening
asbestos reserves, net of the benefit from an indemnification agreement with Citigroup, Inc., a former
affiliate. For the year ended December 31, 2002, the Company’s earnings were not sufficient to cover
fixed charges by $260 million.
267