Travelers 2006 Annual Report Download - page 38
Download and view the complete annual report
Please find page 38 of the 2006 Travelers annual report below. You can navigate through the pages in the report by either clicking on the pages listed below, or by using the keyword search tool below to find specific information within the annual report.-
 1
1 -
2
-
3
-
4
-
5
-
6
-
7
-
8
-
9
-
10
-
11
-
12
-
13
-
14
-
15
-
16
-
17
-
18
-
19
-
20
-
21
-
22
-
23
-
24
-
25
-
26
-
27
-
 28
28 -
 29
29 -
 30
30 -
 31
31 -
 32
32 -
 33
33 -
 34
34 -
 35
35 -
 36
36 -
 37
37 -
 38
38 -
 39
39 -
 40
40 -
 41
41 -
 42
42 -
 43
43 -
 44
44 -
 45
45 -
 46
46 -
 47
47 -
 48
48 -
49
-
50
-
51
-
52
-
53
-
54
-
55
-
56
-
57
-
58
-
59
-
60
-
61
-
62
-
63
-
64
-
65
-
66
-
67
-
68
-
69
-
70
-
71
-
72
-
73
-
74
-
75
-
76
-
77
-
78
-
79
-
80
-
81
-
82
-
83
-
84
-
85
-
86
-
87
-
88
-
89
-
90
-
91
-
92
-
93
-
94
-
95
-
96
-
97
-
98
-
99
-
100
-
101
-
102
-
103
-
104
-
105
-
106
-
107
-
108
-
109
-
110
-
111
-
112
-
113
-
114
-
115
-
116
-
117
-
118
-
119
-
120
-
121
-
122
-
123
-
124
-
125
-
126
-
127
-
128
-
129
-
130
-
131
-
132
-
133
-
134
-
135
-
136
-
137
-
138
-
139
-
140
-
141
-
142
-
143
-
144
-
145
-
146
-
147
-
148
-
149
-
150
-
151
-
152
-
153
-
154
-
155
-
156
-
157
-
158
-
159
-
160
-
161
-
162
-
163
-
164
-
165
-
166
-
167
-
168
-
169
-
170
-
171
-
172
-
173
-
174
-
175
-
176
-
177
-
178
-
179
-
180
-
181
-
182
-
183
-
184
-
185
-
186
-
187
-
188
-
189
-
190
-
191
-
192
-
193
-
194
-
195
-
196
-
197
-
198
-
199
-
200
-
201
-
202
-
203
-
204
-
205
-
206
-
207
-
208
-
209
-
210
-
211
-
212
-
213
-
214
-
215
-
216
-
217
-
218
-
219
-
220
-
221
-
222
-
223
-
224
-
225
-
226
-
227
-
228
-
229
-
230
-
231
-
232
-
233
-
234
-
235
-
236
-
237
-
238
-
239
-
240
-
241
-
242
-
243
-
244
-
245
-
246
-
247
-
248
-
249
-
250
-
251
-
252
-
253
-
254
-
255
-
256
-
257
-
258
-
259
-
260
-
261
-
262
-
263
-
264
-
265
-
266
-
267
-
268
-
269
-
270
-
271
-
272
-
273
-
274
-
275
-
276
-
277
-
278
-
279
-
280
-
281
-
282
-
283
-
284
-
285
 |
 |

26
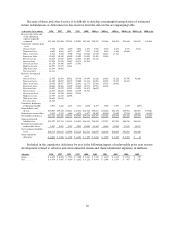
Because of these and other factors, it is difficult to develop a meaningful extrapolation of estimated
future redundancies or deficiencies in loss reserves from the data in the accompanying table.
(at December 31, in millions) 1996 1997 1998 1999 2000 2001(a)2002(a) 2003(a) 2004(a)(b) 2005(a)(b)2006(a)(b)
Reserves for claims and
claim adjustment
expense originally
estimated. .......... $21,816 $ 21,406 $ 20,763 $ 19,983 $ 19,435 $ 20,197 $ 23,268 $ 24,055 $41,446$ 4 2,895$42,844
Cumulative amounts paid
as of
One year later........ 3,704 4,025 4,159 4,082 4,374 5,0185,170 4,651 8,871 8,632
Two years later....... 6,600
6,882 6,879 6,957 7,517 8,7458,3198,686 14,666
Three years later ...... 8,841 8,850 9,006 9,324 10,218 11,149 11,312 11,541
Four years later. ...... 10,355 1
0,48010,809 11,493 12,000 13,402 13,548
Five years later....... 11,649 11,915 12,565 12,911 13,603 15,115
Six years later........ 12,893 1
3,37613,647 14,172 14,958
Seven years later. ..... 14,154 14,306 14,697 15,301
Eight years later ...... 14,987 1
5,22515,681
Nine years later. ...... 15,844 16,061
Ten years later....... 16,223
Reserves reestimated
as of
One year later........ 21,345 21,08320,521 19,736 19,394 23,228 23,658 24,222 41,70642,466
Two years later....... 21,160 20,697 20,172 19,600 22,233 24,083 24,592 25,272 42,565
Three yearslater ...... 20,816 20,417 19,975 22,302 22,778 25,062 25,553 26,042
Four years later. ...... 20,664 20,168 22,489 22,612 23,871 25,953 26,288
Five years later....... 20,427 22,570 22,593 23,591 24,872 26,670
Six years later........ 22,851 22,625 23,492 24,559 25,521
Seven years later. ..... 22,861 23,530 24,446 25,114
Eight years later ...... 23,759 24,425 24,908
Nine years later. ...... 24,601 24,832
Ten years later....... 24,783
Cumulative deficiency
(redundancy)(a)(b). ...2,967 3,426 4,145 5,131 6,086 6,4733,020 1,987 1,119 (429 )
Gross liability–end
of year............. $30,969 $ 30,138 $ 29,411 $ 28,854 $ 28,312 $ 30,617 $ 33,628 $ 34,474 $58,984$ 6 1,007$
59,202
Reinsurance recoverables. 9,153 8,732 8,648 8,871 8,877 10,420 10,360 10,419 17,53818,11216,358
Net liability–end of year .. $ 21,816 $ 2 1,406$ 2 0,763 $ 19,983 $ 19,435 $ 20,197 $ 23,268 $ 24,055 $41,446$ 4 2,895$
42,844
Gross reestimated
liability-latest........ $ 33,970 $ 3 3,724$ 3 4,115 $ 35,055 $ 36,211 $ 38,950 $ 37,927 $ 37,003 $60,376$ 6 1,041
Reestimated reinsurance
recoverables-latest....9,187 8,892 9,207 9,941 10,690 12,280 11,639 10,961 17,81118,575
Net reestimated liability-
latest .............. $ 2 4,783 $ 24,832 $ 24,908 $ 25,114 $ 25,521 $ 26,670 $ 26,288 $ 26,042 $42,565$ 4 2,466
Gross cumulative
deficiency........... $3,001 $3,586 $ 4,704$ 6,201 $ 7,899$ 8,333$4,299$ 2,529 $ 1,392 $34
Included in the cumulative deficiency by year is the following impact of unfavorable prior year reserve
development related toasbestos and environmental claims and claim adjustment expenses, in millions:
Asbestos 1996 1997 1998 1999 2000 2001 2002 2003 2004 2005
Gross....... $6,150 $6,063 $ 5,928$ 5,800 $ 5,613$ 5,330$1,670$ 1,645 $ 1,031 $197
Net......... $4,474 $4,405 $ 4,339$ 4,282 $ 4,232$ 4,043$ 1,098$ 1,074 $ 987 $156