Travelers 2006 Annual Report Download - page 139
Download and view the complete annual report
Please find page 139 of the 2006 Travelers annual report below. You can navigate through the pages in the report by either clicking on the pages listed below, or by using the keyword search tool below to find specific information within the annual report.-
 1
1 -
2
-
3
-
4
-
5
-
6
-
7
-
8
-
9
-
10
-
11
-
12
-
13
-
14
-
15
-
16
-
17
-
18
-
19
-
20
-
21
-
22
-
23
-
24
-
25
-
26
-
27
-
28
-
29
-
30
-
31
-
32
-
33
-
34
-
35
-
36
-
37
-
38
-
39
-
40
-
41
-
42
-
43
-
44
-
45
-
46
-
47
-
48
-
49
-
50
-
51
-
52
-
53
-
54
-
55
-
56
-
57
-
58
-
59
-
60
-
61
-
62
-
63
-
64
-
65
-
66
-
67
-
68
-
69
-
70
-
71
-
72
-
73
-
74
-
75
-
76
-
77
-
78
-
79
-
80
-
81
-
82
-
83
-
84
-
85
-
86
-
87
-
88
-
89
-
90
-
91
-
92
-
93
-
94
-
95
-
96
-
97
-
98
-
99
-
100
-
101
-
102
-
103
-
104
-
105
-
106
-
107
-
108
-
109
-
110
-
111
-
112
-
113
-
114
-
115
-
116
-
117
-
118
-
119
-
120
-
121
-
122
-
123
-
124
-
125
-
126
-
127
-
128
-
 129
129 -
 130
130 -
 131
131 -
 132
132 -
 133
133 -
 134
134 -
 135
135 -
 136
136 -
 137
137 -
 138
138 -
 139
139 -
 140
140 -
 141
141 -
 142
142 -
 143
143 -
 144
144 -
 145
145 -
 146
146 -
 147
147 -
 148
148 -
 149
149 -
150
-
151
-
152
-
153
-
154
-
155
-
156
-
157
-
158
-
159
-
160
-
161
-
162
-
163
-
164
-
165
-
166
-
167
-
168
-
169
-
170
-
171
-
172
-
173
-
174
-
175
-
176
-
177
-
178
-
179
-
180
-
181
-
182
-
183
-
184
-
185
-
186
-
187
-
188
-
189
-
190
-
191
-
192
-
193
-
194
-
195
-
196
-
197
-
198
-
199
-
200
-
201
-
202
-
203
-
204
-
205
-
206
-
207
-
208
-
209
-
210
-
211
-
212
-
213
-
214
-
215
-
216
-
217
-
218
-
219
-
220
-
221
-
222
-
223
-
224
-
225
-
226
-
227
-
228
-
229
-
230
-
231
-
232
-
233
-
234
-
235
-
236
-
237
-
238
-
239
-
240
-
241
-
242
-
243
-
244
-
245
-
246
-
247
-
248
-
249
-
250
-
251
-
252
-
253
-
254
-
255
-
256
-
257
-
258
-
259
-
260
-
261
-
262
-
263
-
264
-
265
-
266
-
267
-
268
-
269
-
270
-
271
-
272
-
273
-
274
-
275
-
276
-
277
-
278
-
279
-
280
-
281
-
282
-
283
-
284
-
285
 |
 |

127
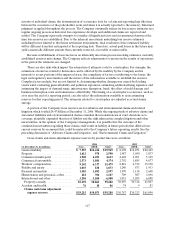
Historically, the one-year change in the reserve estimate for this product line over the last nine years
has varied from -6% to +2% (averaging -3%) for the Company and -2% to +6% (averaging +2%) for the
industry overall. The Company’s year-to-year changes are driven by and are based on observedevents
during the year. The Company believes that its range of historical outcomes is illustrative of reasonably
possible one-year changes in reserve estimates for this product line. Commercial multi-peril reserves
represent approximately 8% of the Company’s total loss reserves.
As discussed above, this line combines general liability and property coverages and it has been
impacted in the past by many of the same events as those two lines.
The Company’s change in reserve estimate for this product line was -4% for 2006, -6% for 2005
and -5% for 2004. The 2006 change was attributable to better than expected results due to, among other
factors, increasingly favorable legal and judicial environments as well as enhanced risk control,
underwriting and claim process initiatives. The 2005 change was the result of increasingly favorable legal
and judicial environments, coupled with better than expected results from changes in policy provisions as
well as underwriting and pricing criteria. The 2004 change was primarily attributable to better than
expected results from changes in underwriting and pricing strategies.
Commercial Automobile
The commercial automobile product line is a mix of property and liability coverages and, therefore,
includes both short and long tail coverages. The payments that are made quickly typically pertain to auto
physical damage (property) claims and property damage (liability) claims. The payments that take longer
to finalize and are more difficult to estimate relate tob
odily injury claims. In general, claim reporting lags
are minor, claim complexityis not a major issue, and the line is viewed ashighfrequency, low to moderate
severity. Overall, the claim liabilities for this line create a moderate estimation risk.
Commercial automobile reserves are typically analyzed in four components; bodily injury liability,
property damage liability, collision claims and comprehensive claims. These lasttwo components have
minimum reserve risk and fast payouts and, accordingly, separate risk factors are not presented.
The Company utilizes the traditional actuarial methods mentioned in the general discussion above in
estimating claim liabilities for this line. This is supplemented with detailed custom analyses where needed.
Examples of common risk factors, or perceptions thereof, that could change and, thus, affect the
required commercial automobile reserves (beyond those included in the general discussion section)
include:
Bodily injury and property damage liability risk factors
Trends in jury awards
Changes in the underlying court system
Changes in case law
Litigation trends
Frequency of claims with payment capped by policy limits
Change in average severity of accidents, or proportion of severe accidents
Changes in auto safety technology
Subrogation opportunities
Changes in claim handling philosophies
Frequency of visits to health providers
Number of medical procedures given during visits to health providers
Types of health providers used
Types of medical treatments received