Travelers 2006 Annual Report Download - page 93
Download and view the complete annual report
Please find page 93 of the 2006 Travelers annual report below. You can navigate through the pages in the report by either clicking on the pages listed below, or by using the keyword search tool below to find specific information within the annual report.-
 1
1 -
2
-
3
-
4
-
5
-
6
-
7
-
8
-
9
-
10
-
11
-
12
-
13
-
14
-
15
-
16
-
17
-
18
-
19
-
20
-
21
-
22
-
23
-
24
-
25
-
26
-
27
-
28
-
29
-
30
-
31
-
32
-
33
-
34
-
35
-
36
-
37
-
38
-
39
-
40
-
41
-
42
-
43
-
44
-
45
-
46
-
47
-
48
-
49
-
50
-
51
-
52
-
53
-
54
-
55
-
56
-
57
-
58
-
59
-
60
-
61
-
62
-
63
-
64
-
65
-
66
-
67
-
68
-
69
-
70
-
71
-
72
-
73
-
74
-
75
-
76
-
77
-
78
-
79
-
80
-
81
-
82
-
 83
83 -
 84
84 -
 85
85 -
 86
86 -
 87
87 -
 88
88 -
 89
89 -
 90
90 -
 91
91 -
 92
92 -
 93
93 -
 94
94 -
 95
95 -
 96
96 -
 97
97 -
 98
98 -
 99
99 -
 100
100 -
 101
101 -
 102
102 -
 103
103 -
104
-
105
-
106
-
107
-
108
-
109
-
110
-
111
-
112
-
113
-
114
-
115
-
116
-
117
-
118
-
119
-
120
-
121
-
122
-
123
-
124
-
125
-
126
-
127
-
128
-
129
-
130
-
131
-
132
-
133
-
134
-
135
-
136
-
137
-
138
-
139
-
140
-
141
-
142
-
143
-
144
-
145
-
146
-
147
-
148
-
149
-
150
-
151
-
152
-
153
-
154
-
155
-
156
-
157
-
158
-
159
-
160
-
161
-
162
-
163
-
164
-
165
-
166
-
167
-
168
-
169
-
170
-
171
-
172
-
173
-
174
-
175
-
176
-
177
-
178
-
179
-
180
-
181
-
182
-
183
-
184
-
185
-
186
-
187
-
188
-
189
-
190
-
191
-
192
-
193
-
194
-
195
-
196
-
197
-
198
-
199
-
200
-
201
-
202
-
203
-
204
-
205
-
206
-
207
-
208
-
209
-
210
-
211
-
212
-
213
-
214
-
215
-
216
-
217
-
218
-
219
-
220
-
221
-
222
-
223
-
224
-
225
-
226
-
227
-
228
-
229
-
230
-
231
-
232
-
233
-
234
-
235
-
236
-
237
-
238
-
239
-
240
-
241
-
242
-
243
-
244
-
245
-
246
-
247
-
248
-
249
-
250
-
251
-
252
-
253
-
254
-
255
-
256
-
257
-
258
-
259
-
260
-
261
-
262
-
263
-
264
-
265
-
266
-
267
-
268
-
269
-
270
-
271
-
272
-
273
-
274
-
275
-
276
-
277
-
278
-
279
-
280
-
281
-
282
-
283
-
284
-
285
 |
 |

81
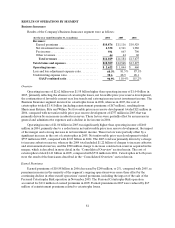
RESULTS OF OPERATIONS BY SEGMENT
Business Insurance
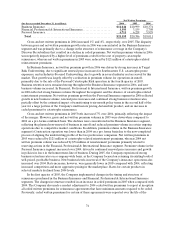
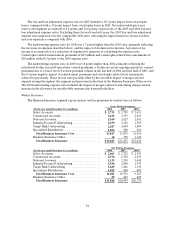
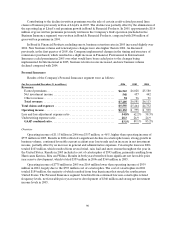
Results of the Company’s Business Insurance segment were as follows:
(for the year ended December 31, in millions) 2006 2005 2004
Revenues:
Earned premiums ............................ $10,876 $11,116 $ 1 0,929
Net investment income. ....................... 2,538 2,341 1,980
Fee income .................................. 591 663 706
Other revenues............................... 44 64 60
Total revenues............................. $14,049 $14,184 $ 1 3,675
Total claims and expenses ....................... $10,509 $12,968 $ 1 3,297
Operating income .............................. $2,622 $1,044 $ 460
Loss and loss adjustment expenseratio ............ 60.3%81.5% 87.1 %
Underwriting expense ratio...................... 30.6 28.9 28.1
GAAP combined ratio....................... 90.9%110.4% 115.2 %
Overview
Operating income of $2.62 billion was $1.58 billion higher than operating income of$1.04 billion in
2005, primarily reflecting the absence of catastrophe losses, net favorable prior year reserve development,
the continuation of favorable current year loss trends and a strong increase in net investment income. The
Business Insurance segment incurred no catastrophe losses in 2006, whereas in 2005, the cost of
catastrophes totaled $1.41 billion (including reinstatement premiumsof $67 million), resulting from
Hurricanes Katrina, Rita and Wilma. Net favorable prior year reserve development totaled $21 million in
2006, compared with net unfavorable prior year reserve development of $757 million in 2005 that was
primarily driven by an increase in asbestos reserves. These factors werepartially offset by an increase in
general and administrative expenses and a decline in fee income in 2006.
Operating income of $1.04 billion in 2005 was significantly higher than operating income of $460
million in 2004, primarily due to a reduction in net unfavorable prior year reserve development, the impact
of the merger and a strong increase in net investment income. These factors were partially offset by a
significant increase in the cost of catastrophesin 2005. Net unfavorable prior year development totaled
$757 million in 2005, compared with $2.03 billion in 2004. The 2005 total was primarily driven by a charge
to increase asbestos reserves, whereas the 2004 total included $1.22 billion of charges to increase asbestos
and environmental reserves, and the $500 million charge to increase construction reserves acquired in the
merger, which is described in more detail in the “Consolidated Overview” section herein. The cost of
catastrophes totaled $1.41 billion in 2005, compared with $532 million in 2004. Catastrophes in both years
were the result of the hurricanes described in the “Consolidated Overview” section herein.
Earned Premiums
Earned premiums of $10.88 billion in 2006 decreased by $240 million, or 2%, compared with 2005, as
premium increases in the majority of the segment’s ongoing operations were more than offset by the
continuing decline in other runoff operations’ earned premiums, including the impact of the saleof the
Personal Catastrophe Risk operation in November 2005. The Personal Catastrophe Risk operation
accounted for $111 million of earned premiums in 2005. Earned premiums in 2005 were reduced by $67
million of reinstatement premiums related to catastrophe losses.