Travelers 2006 Annual Report Download - page 115
Download and view the complete annual report
Please find page 115 of the 2006 Travelers annual report below. You can navigate through the pages in the report by either clicking on the pages listed below, or by using the keyword search tool below to find specific information within the annual report.-
 1
1 -
2
-
3
-
4
-
5
-
6
-
7
-
8
-
9
-
10
-
11
-
12
-
13
-
14
-
15
-
16
-
17
-
18
-
19
-
20
-
21
-
22
-
23
-
24
-
25
-
26
-
27
-
28
-
29
-
30
-
31
-
32
-
33
-
34
-
35
-
36
-
37
-
38
-
39
-
40
-
41
-
42
-
43
-
44
-
45
-
46
-
47
-
48
-
49
-
50
-
51
-
52
-
53
-
54
-
55
-
56
-
57
-
58
-
59
-
60
-
61
-
62
-
63
-
64
-
65
-
66
-
67
-
68
-
69
-
70
-
71
-
72
-
73
-
74
-
75
-
76
-
77
-
78
-
79
-
80
-
81
-
82
-
83
-
84
-
85
-
86
-
87
-
88
-
89
-
90
-
91
-
92
-
93
-
94
-
95
-
96
-
97
-
98
-
99
-
100
-
101
-
102
-
103
-
104
-
 105
105 -
 106
106 -
 107
107 -
 108
108 -
 109
109 -
 110
110 -
 111
111 -
 112
112 -
 113
113 -
 114
114 -
 115
115 -
 116
116 -
 117
117 -
 118
118 -
 119
119 -
 120
120 -
 121
121 -
 122
122 -
 123
123 -
 124
124 -
 125
125 -
126
-
127
-
128
-
129
-
130
-
131
-
132
-
133
-
134
-
135
-
136
-
137
-
138
-
139
-
140
-
141
-
142
-
143
-
144
-
145
-
146
-
147
-
148
-
149
-
150
-
151
-
152
-
153
-
154
-
155
-
156
-
157
-
158
-
159
-
160
-
161
-
162
-
163
-
164
-
165
-
166
-
167
-
168
-
169
-
170
-
171
-
172
-
173
-
174
-
175
-
176
-
177
-
178
-
179
-
180
-
181
-
182
-
183
-
184
-
185
-
186
-
187
-
188
-
189
-
190
-
191
-
192
-
193
-
194
-
195
-
196
-
197
-
198
-
199
-
200
-
201
-
202
-
203
-
204
-
205
-
206
-
207
-
208
-
209
-
210
-
211
-
212
-
213
-
214
-
215
-
216
-
217
-
218
-
219
-
220
-
221
-
222
-
223
-
224
-
225
-
226
-
227
-
228
-
229
-
230
-
231
-
232
-
233
-
234
-
235
-
236
-
237
-
238
-
239
-
240
-
241
-
242
-
243
-
244
-
245
-
246
-
247
-
248
-
249
-
250
-
251
-
252
-
253
-
254
-
255
-
256
-
257
-
258
-
259
-
260
-
261
-
262
-
263
-
264
-
265
-
266
-
267
-
268
-
269
-
270
-
271
-
272
-
273
-
274
-
275
-
276
-
277
-
278
-
279
-
280
-
281
-
282
-
283
-
284
-
285
 |
 |

103
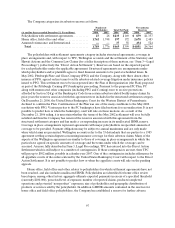
At December 31, 2006 and 2005, the Company held CMOs classified as available for sale with a fair
value of $3.56 billion and $3.43 billion, respectively (excluding Commercial Mortgage-Backed Securities of
$1.07 billion and $1.16 billion, respectively). Approximately 36% and 43% of the Company’s CMO
holdings are guaranteed by or fully collateralized by securities issued by GNMA, FNMA or FHLMC at
December 31, 2006 and 2005, respectively. In addition, the Company held $4.36 billion and $4.83 billion of
GNMA, FNMA, FHLMC or FHA mortgage-backed pass-through securities classified as available for sale
at December 31, 2006 and 2005, respectively. Virtually all of these securities are rated Aaa.
The Company’s real estate investments include warehouses and office buildings and other commercial
land and properties that are directly owned. The Company’s other investments primarily comprise venture
capital, through direct ownership and limited partnerships, private equity limited partnerships, joint
ventures, other limited partnerships and trading securities, which are subject to more volatility than the
Company’s fixed income investments, but historically have provided a higher return. At December 31, 2006
and 2005, the carrying value of the Company’s other investments was $3.40 billion and $3.17 billion,
respectively.
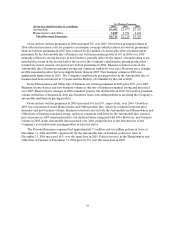
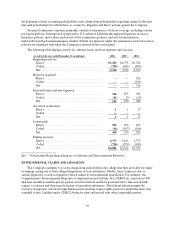
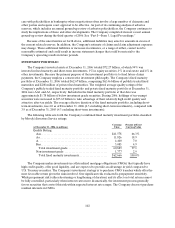
The net unrealized investment gains (losses) that were included as a separate component of
accumulated other changes in equity from nonowner sources were as follows:
(for the year ended December 31, in millions)2006 2005 2004
Fixed maturities........................................ $ 4 22 $ 3 67 $1,252
Equity securities. ....................................... 37 41 72
Venture capital. ........................................ 108 89 11
Other investments (excluding venture capital).............. 113 (12) 2
Unrealized investment gains before tax. ................. 680 485 1,337
Provision for taxes ...................................... 227 158 469
Net unrealized investmentgains at end of year ........... $ 4 53 $ 3 27 $868
Net pretax unrealizedinvestment gains at December 31, 2006 increased by $195 million over year-end
2005, primarily concentrated in the fixed maturity portfolio and in other investments carried at fair value.
The increase in net unrealized investment gains on fixed maturities was primarily driven by the impact of
declining market interest rates on tax-exempt securities, which was partially offset by a slight increase in
market interest rates on taxable securities.
Net pretax unrealizedinvestment gains at December 31, 2005 declined by $852 million from year-end
2004, primarily reflecting an $885 million pretax decrease in the net unrealized gain on fixed maturities
that was driven by an increase in market interest rates in2005. Partially offsetting this decrease was a
$78 million increase in pretax unrealized gains on the venture capital portfolio, which reflected favorable
results from several of the investments comprising this category, net of losses realized through other-than-
temporary impairments.
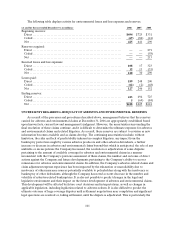
Impairment charges included in net realized investment gains (losses) were as follows:
(for the year ended December 31, in millions) 2006 2005 2004
Fixed maturities......................................... $ 7$ 11 $ 25
Equity securities. ........................................ 4— 5
Venture capital. ......................................... 33 80 40
Other investments (excluding venture capital)............... 418 10
Total ................................................ $ 48 $ 109 $ 80