Travelers 2006 Annual Report Download - page 91
Download and view the complete annual report
Please find page 91 of the 2006 Travelers annual report below. You can navigate through the pages in the report by either clicking on the pages listed below, or by using the keyword search tool below to find specific information within the annual report.-
 1
1 -
2
-
3
-
4
-
5
-
6
-
7
-
8
-
9
-
10
-
11
-
12
-
13
-
14
-
15
-
16
-
17
-
18
-
19
-
20
-
21
-
22
-
23
-
24
-
25
-
26
-
27
-
28
-
29
-
30
-
31
-
32
-
33
-
34
-
35
-
36
-
37
-
38
-
39
-
40
-
41
-
42
-
43
-
44
-
45
-
46
-
47
-
48
-
49
-
50
-
51
-
52
-
53
-
54
-
55
-
56
-
57
-
58
-
59
-
60
-
61
-
62
-
63
-
64
-
65
-
66
-
67
-
68
-
69
-
70
-
71
-
72
-
73
-
74
-
75
-
76
-
77
-
78
-
79
-
80
-
 81
81 -
 82
82 -
 83
83 -
 84
84 -
 85
85 -
 86
86 -
 87
87 -
 88
88 -
 89
89 -
 90
90 -
 91
91 -
 92
92 -
 93
93 -
 94
94 -
 95
95 -
 96
96 -
 97
97 -
 98
98 -
 99
99 -
 100
100 -
 101
101 -
102
-
103
-
104
-
105
-
106
-
107
-
108
-
109
-
110
-
111
-
112
-
113
-
114
-
115
-
116
-
117
-
118
-
119
-
120
-
121
-
122
-
123
-
124
-
125
-
126
-
127
-
128
-
129
-
130
-
131
-
132
-
133
-
134
-
135
-
136
-
137
-
138
-
139
-
140
-
141
-
142
-
143
-
144
-
145
-
146
-
147
-
148
-
149
-
150
-
151
-
152
-
153
-
154
-
155
-
156
-
157
-
158
-
159
-
160
-
161
-
162
-
163
-
164
-
165
-
166
-
167
-
168
-
169
-
170
-
171
-
172
-
173
-
174
-
175
-
176
-
177
-
178
-
179
-
180
-
181
-
182
-
183
-
184
-
185
-
186
-
187
-
188
-
189
-
190
-
191
-
192
-
193
-
194
-
195
-
196
-
197
-
198
-
199
-
200
-
201
-
202
-
203
-
204
-
205
-
206
-
207
-
208
-
209
-
210
-
211
-
212
-
213
-
214
-
215
-
216
-
217
-
218
-
219
-
220
-
221
-
222
-
223
-
224
-
225
-
226
-
227
-
228
-
229
-
230
-
231
-
232
-
233
-
234
-
235
-
236
-
237
-
238
-
239
-
240
-
241
-
242
-
243
-
244
-
245
-
246
-
247
-
248
-
249
-
250
-
251
-
252
-
253
-
254
-
255
-
256
-
257
-
258
-
259
-
260
-
261
-
262
-
263
-
264
-
265
-
266
-
267
-
268
-
269
-
270
-
271
-
272
-
273
-
274
-
275
-
276
-
277
-
278
-
279
-
280
-
281
-
282
-
283
-
284
-
285
 |
 |
79
During the second quarter of 2004, a participating co-surety on the specific construction contractor
described above announced that insurance regulators had approved its submittedrun-off plan. Based upon
industry’s knowledge of the co-surety’s run-off plan and the Company’s analysis of its financial condition,
the Company concluded thatit was unlikely to collect the full amount projected to be owed by the co-
surety and established an appropriate level of reserves. In the second quarter of 2005, the Company
reached a settlement with the co-surety whereby the co-surety made a paymentto the Company and was
released from further financial obligations tothe Company in connection with the specific construction
exposure. The settlement payment, coupled with the previously established co-surety reserves,
approximated the Company’s estimate of the co-surety’s share of the bonded losses related to this
exposure.
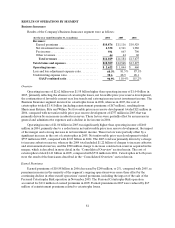
Interest Expense
Interest expense in 2006 was $38 million higher than in 2005, primarily due to the issuance in
November 2005 of $400 million, 5.50% senior notes due December 1, 2015, and theissuance in June 2006
policyholders for loss sensitive business are insurance contract-related assets, these assets are subject to the
same types of estimation variables as loss reserves.
of $400 million, 6.25% senior notes due June 20, 2016 and $400 million, 6.75% senior notes due June20,
2036. The proceeds from the 2006 debt issuances were used to fund the redemption and maturity in 2006
of certain of the Company’s outstanding debt.
The $50 million increase in interest expense in 2005 over 2004 primarily reflected the impact of a full
year of interest expense on SPC debt assumed in the merger on April 1, 2004. The Company’s debt
outstanding at December 31, 2005 declined by a net $463 million compared with year-end 2004.
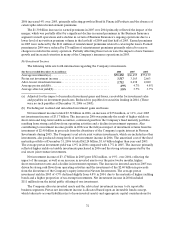
Effective Tax Rate
The Company’s effective tax rate on income from continuing operations was 26.5%, 22.8% and 7.3%
in 2006, 2005 and 2004, respectively. The 2006and 2005 effective rate reflected a higher level of pretax
income associated with profitable underwriting performance. The low 2004 effective rate primarily
reflected the impact of nontaxable investment income on a lower level of pretax income.
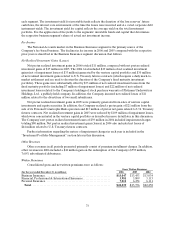
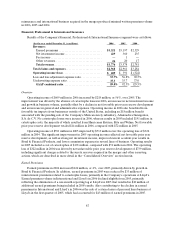
GAAP combined ratios
The consolidated loss and loss adjustment expense ratio of 57.5% in 2006 improved by 14.4 points
compared with 2005, primarily reflecting the decline in catastrophe losses. Catastrophe losses accounted
for 0.5 points of the 2006 loss and loss adjustment expense ratio, compared with a 10.3 point impact in
2005. The 2006 loss and loss adjustment expense ratio included a 1.9 point impact from net favorable prior
year reserve development, whereas the 2005 loss and loss adjustment expense ratio included a 1.6 point
impact from net unfavorable prior year reserve development. The 2006 loss and loss adjustment expense
ratio excluding catastrophe losses and prior year reserve development improved over the 2005 ratio on the
same basis, reflecting improvement in frequency and severity trends in several lines of business. The
underwriting expenseratio for 2006 was 1.2 points higher than the underwriting exp ense ratio in 2005. The
changes primarily reflect the impact of the increase in general and administrative expenses described
previously. In addition, the 2006 ratio was negatively impacted by a decline in National Accounts’ fee
income, a portion of which isaccounted for as a reduction of expenses for purposes of calculating the
expense ratio. The underwriting expense ratio in 2005 also included a 0.4 point impact from reinstatement
premiums and state assessments.
Catastrophe losses accounted for 10.3 points of the 2005 loss and loss adjustment expense ratio,
compared with 4.0points in 2004. The loss and loss adjustment expense ratio in 2005 included a 1.6 point
impact of net unfavorable prior year reserve development, whereas the 2004 ratio included a 12.6 point
impact of net unfavorable prior year reserve development. The2005 loss and loss adjustment expenseratio