Travelers 2006 Annual Report Download - page 96
Download and view the complete annual report
Please find page 96 of the 2006 Travelers annual report below. You can navigate through the pages in the report by either clicking on the pages listed below, or by using the keyword search tool below to find specific information within the annual report.-
 1
1 -
2
-
3
-
4
-
5
-
6
-
7
-
8
-
9
-
10
-
11
-
12
-
13
-
14
-
15
-
16
-
17
-
18
-
19
-
20
-
21
-
22
-
23
-
24
-
25
-
26
-
27
-
28
-
29
-
30
-
31
-
32
-
33
-
34
-
35
-
36
-
37
-
38
-
39
-
40
-
41
-
42
-
43
-
44
-
45
-
46
-
47
-
48
-
49
-
50
-
51
-
52
-
53
-
54
-
55
-
56
-
57
-
58
-
59
-
60
-
61
-
62
-
63
-
64
-
65
-
66
-
67
-
68
-
69
-
70
-
71
-
72
-
73
-
74
-
75
-
76
-
77
-
78
-
79
-
80
-
81
-
82
-
83
-
84
-
85
-
 86
86 -
 87
87 -
 88
88 -
 89
89 -
 90
90 -
 91
91 -
 92
92 -
 93
93 -
 94
94 -
 95
95 -
 96
96 -
 97
97 -
 98
98 -
 99
99 -
 100
100 -
 101
101 -
 102
102 -
 103
103 -
 104
104 -
 105
105 -
 106
106 -
107
-
108
-
109
-
110
-
111
-
112
-
113
-
114
-
115
-
116
-
117
-
118
-
119
-
120
-
121
-
122
-
123
-
124
-
125
-
126
-
127
-
128
-
129
-
130
-
131
-
132
-
133
-
134
-
135
-
136
-
137
-
138
-
139
-
140
-
141
-
142
-
143
-
144
-
145
-
146
-
147
-
148
-
149
-
150
-
151
-
152
-
153
-
154
-
155
-
156
-
157
-
158
-
159
-
160
-
161
-
162
-
163
-
164
-
165
-
166
-
167
-
168
-
169
-
170
-
171
-
172
-
173
-
174
-
175
-
176
-
177
-
178
-
179
-
180
-
181
-
182
-
183
-
184
-
185
-
186
-
187
-
188
-
189
-
190
-
191
-
192
-
193
-
194
-
195
-
196
-
197
-
198
-
199
-
200
-
201
-
202
-
203
-
204
-
205
-
206
-
207
-
208
-
209
-
210
-
211
-
212
-
213
-
214
-
215
-
216
-
217
-
218
-
219
-
220
-
221
-
222
-
223
-
224
-
225
-
226
-
227
-
228
-
229
-
230
-
231
-
232
-
233
-
234
-
235
-
236
-
237
-
238
-
239
-
240
-
241
-
242
-
243
-
244
-
245
-
246
-
247
-
248
-
249
-
250
-
251
-
252
-
253
-
254
-
255
-
256
-
257
-
258
-
259
-
260
-
261
-
262
-
263
-
264
-
265
-
266
-
267
-
268
-
269
-
270
-
271
-
272
-
273
-
274
-
275
-
276
-
277
-
278
-
279
-
280
-
281
-
282
-
283
-
284
-
285
 |
 |

84
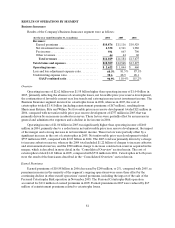
The loss and loss adjustment expense ratio in 2005 included a 12.3 point impact fromcatastrophe
losses, compared with a 4.9point impact from catastrophe losses in 2004. Net unfavorable prioryear
reserve development accounted for 6.8 points and 18.6 points, respectively, of the 2005 and 2004 loss and
loss adjustment expense ratios. Excluding these factors from both years, the 2005 loss and loss adjustment
expense ratio improved over the comparable 2004 ratio, reflecting the improvement in current accident
year loss experience compared with 2004.
The underwriting expense ratio for 2006 was 1.7 points higher than the 2005 ratio, primarily reflecting
the increases in expenses described above, and the impact of declines in fee income. A portion of fee
income is accounted for as a reduction of expenses for purposes of calculating the expense ratio.
Catastrophe-related reinstatement premiums of $67 million and catastrophe-relatedstate assessments of
$18 million added 0.3 points to the 2005 expense ratio.
The underwriting expense ratio in 2005 was 0.8 points higher than 2004, primarily reflecting the
intentional decline in runoff operations’ earned premiums, a decline in certain ongoing operations’ earned
premiums due to a lower level of written premium volume in the last half of 2004 and first half of 2005, and
the 0.3 point negative impact of reinstatement premiums and catastrophe-related state assessments
referred to previously. These factors were partially offset by the favorable impact of merger-related
expense savings throughout the segment and personnel reductions in the Business Insurance Other sector.
The 2004 underwriting expense ratio included the impact of merger-related restructuring charges and an
increase in the allowance for uncollectible amounts due from policyholders.
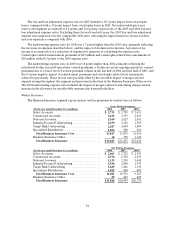
Written Premiums
The BusinessInsurance segment’s gross and net written premiums by market were as follows:
Gross Written Premiums
(for the year ended December 31, in millions) 2006 2005 200 4
Select Accounts .................................. $ 2,733 $ 2,799 $ 2,631
Commercial Accounts............................. 2,613 2,535 2,463
National Accounts................................ 2,169 2,627 2,410
Industry-Focused Underwriting.................... 2,279 2,154 1,785
Target Risk Underwriting......................... 2,187 2,040 1,809
Specialized Distribution........................... 1,036 920 816
Total Business Insurance Core................... 13,017 13,075 11,914
Business Insurance Other.......................... 30 378 1,120
Total Business Insurance........................ $ 1 3,047 $ 13,453 $ 13,034
Net Written Premiums
(for the year ended December 31, in millions) 2006 2005 2004
Select Accounts .................................. $ 2,663 $ 2,722 $ 2,555
Commercial Accounts............................. 2,376 2,330 2,273
National Accounts................................ 1,135 1,230 1,040
Industry-Focused Underwriting.................... 2,196 2,080 1,747
Target Risk Underwriting......................... 1,629 1,482 1,345
Specialized Distribution........................... 1,022 908 807
Total Business Insurance Core................... 11,021 10,752 9,767
Business Insurance Other.......................... 25 247 607
Total Business Insurance........................ $ 1 1,046 $ 10,999 $ 10,374