Travelers 2006 Annual Report Download - page 148
Download and view the complete annual report
Please find page 148 of the 2006 Travelers annual report below. You can navigate through the pages in the report by either clicking on the pages listed below, or by using the keyword search tool below to find specific information within the annual report.-
 1
1 -
2
-
3
-
4
-
5
-
6
-
7
-
8
-
9
-
10
-
11
-
12
-
13
-
14
-
15
-
16
-
17
-
18
-
19
-
20
-
21
-
22
-
23
-
24
-
25
-
26
-
27
-
28
-
29
-
30
-
31
-
32
-
33
-
34
-
35
-
36
-
37
-
38
-
39
-
40
-
41
-
42
-
43
-
44
-
45
-
46
-
47
-
48
-
49
-
50
-
51
-
52
-
53
-
54
-
55
-
56
-
57
-
58
-
59
-
60
-
61
-
62
-
63
-
64
-
65
-
66
-
67
-
68
-
69
-
70
-
71
-
72
-
73
-
74
-
75
-
76
-
77
-
78
-
79
-
80
-
81
-
82
-
83
-
84
-
85
-
86
-
87
-
88
-
89
-
90
-
91
-
92
-
93
-
94
-
95
-
96
-
97
-
98
-
99
-
100
-
101
-
102
-
103
-
104
-
105
-
106
-
107
-
108
-
109
-
110
-
111
-
112
-
113
-
114
-
115
-
116
-
117
-
118
-
119
-
120
-
121
-
122
-
123
-
124
-
125
-
126
-
127
-
128
-
129
-
130
-
131
-
132
-
133
-
134
-
135
-
136
-
137
-
 138
138 -
 139
139 -
 140
140 -
 141
141 -
 142
142 -
 143
143 -
 144
144 -
 145
145 -
 146
146 -
 147
147 -
 148
148 -
 149
149 -
 150
150 -
 151
151 -
 152
152 -
 153
153 -
 154
154 -
 155
155 -
 156
156 -
 157
157 -
 158
158 -
159
-
160
-
161
-
162
-
163
-
164
-
165
-
166
-
167
-
168
-
169
-
170
-
171
-
172
-
173
-
174
-
175
-
176
-
177
-
178
-
179
-
180
-
181
-
182
-
183
-
184
-
185
-
186
-
187
-
188
-
189
-
190
-
191
-
192
-
193
-
194
-
195
-
196
-
197
-
198
-
199
-
200
-
201
-
202
-
203
-
204
-
205
-
206
-
207
-
208
-
209
-
210
-
211
-
212
-
213
-
214
-
215
-
216
-
217
-
218
-
219
-
220
-
221
-
222
-
223
-
224
-
225
-
226
-
227
-
228
-
229
-
230
-
231
-
232
-
233
-
234
-
235
-
236
-
237
-
238
-
239
-
240
-
241
-
242
-
243
-
244
-
245
-
246
-
247
-
248
-
249
-
250
-
251
-
252
-
253
-
254
-
255
-
256
-
257
-
258
-
259
-
260
-
261
-
262
-
263
-
264
-
265
-
266
-
267
-
268
-
269
-
270
-
271
-
272
-
273
-
274
-
275
-
276
-
277
-
278
-
279
-
280
-
281
-
282
-
283
-
284
-
285
 |
 |

136
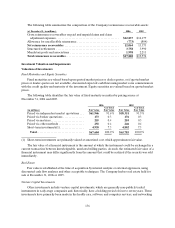
The following table summarizes the composition of the Company’s reinsurance recoverable assets:
(at December 31, in millions) 2006 2005
Gross reinsurance recoverables on paid and unpaid claims and claim
adjustment expenses............................................. $12,837
$ 1 4,177
Allowance for uncollectible reinsurance .............................. (773 )(804 )
Net reinsurance recoverables ....................................... 12,064
13,373
Structured settlements ............................................. 3,758
3,990
Mandatory pools and associations................................... 1,998
2,211
Total reinsurance recoverables ...................................... $17,820
$ 1 9,574
Investment Valuation and Impairments
Valuation of Investments
Fixed Maturities and Equity Securities
Fixed maturities are valued based upon quoted market prices or dealer quotes, or if quoted market
prices or dealer quotes are notavailable, discounted expected cash flows using market rates commensurate
with the credit quality and maturity of the investment. Equity securities are valued based on quoted market
prices.
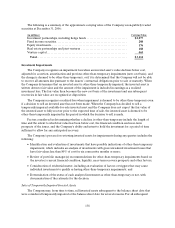
The following table identifies the fair value of fixed maturity securities by pricing source at
December 31, 2006 and 2005.
2006 2005
(in millions)Fair Value
% of Total
Fair Value Fair Value
% of Total
Fair Value
Priced via independent marketquotations ...$ 61,946 91.6%$ 58,35191.5 %
Priced via broker quotations ............... 1730.3176 0.3
Priced via matrices. ....................... 2550.4210 0.3
Priced via other methods .................. 2920.4246 0.4
Short-term investments(1) ................. 4,9387.34,802 7.5
Total.................................. $ 67,604 100.0%$ 63,785100.0 %
(1) Short-term investments are primarily valued at amortized cost, which approximates fairvalue.
The fair value of a financial instrument is the amount at which the instrument could be exchanged in a
current transaction between knowledgeable, unrelated willing parties. As such, the estimated fair value of a
financial instrument may differ significantly from the amount that could be realized if the security was sold
immediately.
Real Estate
Fair value is established at the time of acquisition by internal analysis or external appraisers, using
discounted cash flow analyses and other acceptable techniques. The Company had no real estate held for
sale at December 31, 2006 or 2005.
Venture Capital Investments
Other investments include venture capital investments, which are generally non-publicly traded
instruments in early-stage companies and, historically, have a holdingperiod of four to seven years. These
investments have primarily been made inthe health care, software and computer services, andnetworking