Travelers 2006 Annual Report Download - page 84
Download and view the complete annual report
Please find page 84 of the 2006 Travelers annual report below. You can navigate through the pages in the report by either clicking on the pages listed below, or by using the keyword search tool below to find specific information within the annual report.-
 1
1 -
2
-
3
-
4
-
5
-
6
-
7
-
8
-
9
-
10
-
11
-
12
-
13
-
14
-
15
-
16
-
17
-
18
-
19
-
20
-
21
-
22
-
23
-
24
-
25
-
26
-
27
-
28
-
29
-
30
-
31
-
32
-
33
-
34
-
35
-
36
-
37
-
38
-
39
-
40
-
41
-
42
-
43
-
44
-
45
-
46
-
47
-
48
-
49
-
50
-
51
-
52
-
53
-
54
-
55
-
56
-
57
-
58
-
59
-
60
-
61
-
62
-
63
-
64
-
65
-
66
-
67
-
68
-
69
-
70
-
71
-
72
-
73
-
 74
74 -
 75
75 -
 76
76 -
 77
77 -
 78
78 -
 79
79 -
 80
80 -
 81
81 -
 82
82 -
 83
83 -
 84
84 -
 85
85 -
 86
86 -
 87
87 -
 88
88 -
 89
89 -
 90
90 -
 91
91 -
 92
92 -
 93
93 -
 94
94 -
95
-
96
-
97
-
98
-
99
-
100
-
101
-
102
-
103
-
104
-
105
-
106
-
107
-
108
-
109
-
110
-
111
-
112
-
113
-
114
-
115
-
116
-
117
-
118
-
119
-
120
-
121
-
122
-
123
-
124
-
125
-
126
-
127
-
128
-
129
-
130
-
131
-
132
-
133
-
134
-
135
-
136
-
137
-
138
-
139
-
140
-
141
-
142
-
143
-
144
-
145
-
146
-
147
-
148
-
149
-
150
-
151
-
152
-
153
-
154
-
155
-
156
-
157
-
158
-
159
-
160
-
161
-
162
-
163
-
164
-
165
-
166
-
167
-
168
-
169
-
170
-
171
-
172
-
173
-
174
-
175
-
176
-
177
-
178
-
179
-
180
-
181
-
182
-
183
-
184
-
185
-
186
-
187
-
188
-
189
-
190
-
191
-
192
-
193
-
194
-
195
-
196
-
197
-
198
-
199
-
200
-
201
-
202
-
203
-
204
-
205
-
206
-
207
-
208
-
209
-
210
-
211
-
212
-
213
-
214
-
215
-
216
-
217
-
218
-
219
-
220
-
221
-
222
-
223
-
224
-
225
-
226
-
227
-
228
-
229
-
230
-
231
-
232
-
233
-
234
-
235
-
236
-
237
-
238
-
239
-
240
-
241
-
242
-
243
-
244
-
245
-
246
-
247
-
248
-
249
-
250
-
251
-
252
-
253
-
254
-
255
-
256
-
257
-
258
-
259
-
260
-
261
-
262
-
263
-
264
-
265
-
266
-
267
-
268
-
269
-
270
-
271
-
272
-
273
-
274
-
275
-
276
-
277
-
278
-
279
-
280
-
281
-
282
-
283
-
284
-
285
 |
 |

72
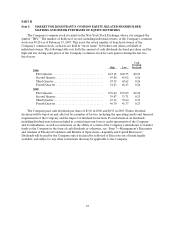
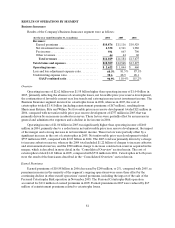
2006 increased 4% over 2005, primarily reflecting growth in Bond & Financial Products and the absence of
catastrophe-related reinstatement premiums.
The $1.30 billion increase in earned premiums in 2005 over 2004 primarily reflected the impact of the
merger, which was partially offset by a significant decline in earned premiums in the Business Insurance
segment’s runoff operations and a decline in certain of Business Insurance’s ongoing operations due to a
lower level of net written premium volume in the last half of 2004 and first half of 2005. Earnedpremiums
in 2005 were reduced by the $121 million of reinstatement premiums related to catastrophe losses. Earned
premiums in 2004 were reduced by $76 million of reinstatement premiums primarily related to reserve
charges recorded in the surety operation. Partially offsetting these factors were the impacts of new business
growth and increased retention in many of the Company’s insurance operations in 2005.
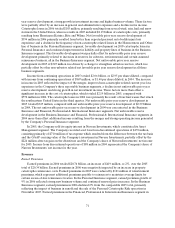
Net Investment Income
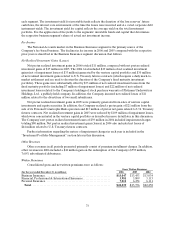
The following table sets forth information regarding the Company’s investments.
(for the year ended December 31, in millions)2006 2005 2004
Average investments(a).......................................... $ 7 1,252 $66,695 $ 5 5,139
Pretax net investment income.................................... 3,517 3,165 2,663
After-tax net investment income .................................. 2,712 2,438 2,020
Average pretaxyield(b). ......................................... 4.9%4.7% 4.8%
Average after-tax yield(b)........................................ 3.8%3.7% 3.7%
(a) Adjusted for the impact of unrealized investment gains and losses, receivables for investment sales
and payables on investment purchases. Reduced for payables for securities lending in 2004. (There
were no such payables at December 31, 2006 or 2005).
(b) Excluding net realized and unrealized investment gains and losses.
Net investment income totaled $3.52 billion in 2006, an increase of $352 million, or 11%, over 2005
net investment income of $3.17 billion. The increase in 2006 was primarily the result of higher yields on
short-term and long-term taxable securities, continued growth in the Company’s fixed maturity portfolio
resulting from strong cash flows from operating activities and a decline in investment expenses. Also
contributing to investment income growth in 2006 was the full-year impact of investment returns from the
investment of $2.40 billion in proceeds from the divestiture of the Company’s equity interest in Nuveen
Investments during 2005. The Company’s real estate joint venture investments, which are included in other
investments, also produced strong levels of net investment income in 2006. The amortized cost of the fixed
maturity portfolio at December 31, 2006 totaled $62.24 billion, $3.63 billion higher than year-end 2005.
The average pretax investment yield was 4.9% in 2006 compared with 4.7% in 2005. The increaseprimarily
reflected higher yields on taxable investments purchased in 2006 and the strong returns generated by the
real estate joint venture investments.
Net investment income of $3.17 billion in 2005 grew $502 million, or 19%, over 2004, reflecting the
impact of the merger, as well as an increase in invested assets over theprior twelve months, higher
short-term interest rates and a decline in investment expenses. The increase in invested assets in 2005 was
driven by strong cash flows from operating activities and the investment of the $2.40 billion in proceeds
from the divestiture of the Company’s equity interest in Nuveen Investments. The average pretax
investment yield in2005 of 4.7% declined slightly from 4.8% in 2004, due to the maturity of higher yielding
bonds and a higher proportion of tax-exempt investments. Net investment income in 2004 included
$111 million from the initial public offering of one investment.
The Company allocates invested assets and the related net investment income to its reportable
business segments. Pretax net investment income is allocated based upon an investable funds concept,
which takes into account liabilities (netof non-investedassets) and appropriate capital considerations for