Travelers 2006 Annual Report Download - page 103
Download and view the complete annual report
Please find page 103 of the 2006 Travelers annual report below. You can navigate through the pages in the report by either clicking on the pages listed below, or by using the keyword search tool below to find specific information within the annual report.-
 1
1 -
2
-
3
-
4
-
5
-
6
-
7
-
8
-
9
-
10
-
11
-
12
-
13
-
14
-
15
-
16
-
17
-
18
-
19
-
20
-
21
-
22
-
23
-
24
-
25
-
26
-
27
-
28
-
29
-
30
-
31
-
32
-
33
-
34
-
35
-
36
-
37
-
38
-
39
-
40
-
41
-
42
-
43
-
44
-
45
-
46
-
47
-
48
-
49
-
50
-
51
-
52
-
53
-
54
-
55
-
56
-
57
-
58
-
59
-
60
-
61
-
62
-
63
-
64
-
65
-
66
-
67
-
68
-
69
-
70
-
71
-
72
-
73
-
74
-
75
-
76
-
77
-
78
-
79
-
80
-
81
-
82
-
83
-
84
-
85
-
86
-
87
-
88
-
89
-
90
-
91
-
92
-
 93
93 -
 94
94 -
 95
95 -
 96
96 -
 97
97 -
 98
98 -
 99
99 -
 100
100 -
 101
101 -
 102
102 -
 103
103 -
 104
104 -
 105
105 -
 106
106 -
 107
107 -
 108
108 -
 109
109 -
 110
110 -
 111
111 -
 112
112 -
 113
113 -
114
-
115
-
116
-
117
-
118
-
119
-
120
-
121
-
122
-
123
-
124
-
125
-
126
-
127
-
128
-
129
-
130
-
131
-
132
-
133
-
134
-
135
-
136
-
137
-
138
-
139
-
140
-
141
-
142
-
143
-
144
-
145
-
146
-
147
-
148
-
149
-
150
-
151
-
152
-
153
-
154
-
155
-
156
-
157
-
158
-
159
-
160
-
161
-
162
-
163
-
164
-
165
-
166
-
167
-
168
-
169
-
170
-
171
-
172
-
173
-
174
-
175
-
176
-
177
-
178
-
179
-
180
-
181
-
182
-
183
-
184
-
185
-
186
-
187
-
188
-
189
-
190
-
191
-
192
-
193
-
194
-
195
-
196
-
197
-
198
-
199
-
200
-
201
-
202
-
203
-
204
-
205
-
206
-
207
-
208
-
209
-
210
-
211
-
212
-
213
-
214
-
215
-
216
-
217
-
218
-
219
-
220
-
221
-
222
-
223
-
224
-
225
-
226
-
227
-
228
-
229
-
230
-
231
-
232
-
233
-
234
-
235
-
236
-
237
-
238
-
239
-
240
-
241
-
242
-
243
-
244
-
245
-
246
-
247
-
248
-
249
-
250
-
251
-
252
-
253
-
254
-
255
-
256
-
257
-
258
-
259
-
260
-
261
-
262
-
263
-
264
-
265
-
266
-
267
-
268
-
269
-
270
-
271
-
272
-
273
-
274
-
275
-
276
-
277
-
278
-
279
-
280
-
281
-
282
-
283
-
284
-
285
 |
 |
91
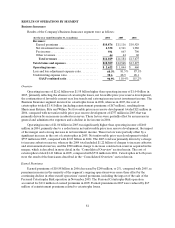
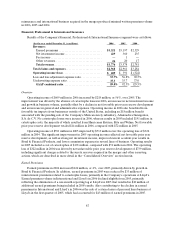
Earned Premiums
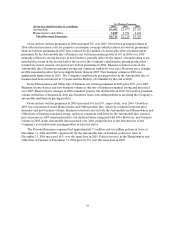
Earned premiums of $6.56billion in 2006 increased 9% over the 2005 total of $6.03 billion, primarily
due to significant new business volume, renewal price increases and continued strong business retention
rates over the prior twelve months. Earned premiums in 2005 were reduced by $21 million of catastrophe-
related reinstatement premiums. Earnedpremiums of $6.03 billion in 2005 increased $448 million, or 8%,
over 2004 earned premiums of $5.58 billion, reflecting continued strong business retention levels, new
business volumes and renewal price increases over the prior twelve months.
Net Investment Income
Refer to the “Net Investment Income” section of the “Consolidated Results of Operations” discussion
herein for a description of the factors contributing to the increase in the Company’s net investment income
in 2006 and 2005.
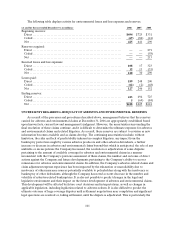
Claims and Expenses
Claims and claim adjustment expenses in 2006 totaled $3.60 billion, compared with $3.75 billion in
2005. The $154 million decline primarily reflected a reduction in catastrophe losses, which was partially
offset by the impact of higher business volume in 2006. Catastrophe losses totaled $103 million in 2006,
down significantly from the 2005 total of $547 million.
Net favorable prior year reserve development in 2006 and 2005 was $359 million and $360 million,
respectively. The net favorable prior year reserve development in 2006 was driven by better than expected
loss experience in the auto bodily injury andnon-catastrophe related Homeowners and Other lines of
business, and a reduction in loss estimates for the 2005 hurricanes. In the Automobile line of business, for
2006 and 2005, the improvement was partially driven by better than expected results from changes in claim
handling practices. These changes included practices which have allowed case reserves to be established
more accurately earlier in the claim settlement process, thereby changinghistorical loss development
patterns. In addition, for both years, industry and Company initiatives to fight fraud in several states led to
a decrease in the total number of claims and a change in historical loss development patterns. In the
Homeowners and Other line of business, favorable prior year reserve development in 2006 and 2005 was
partially driven by a significant decrease in the number of claims, attributable to changes in the
marketplace, including higher deductibles and fewer small-dollar claims. These changes also resulted in a
change in historical loss development patterns. In addition, for 2006, non-catastrophe related Homeowners
and Other loss experience was favorable due to continued evidenceof a less than expected impact from
“demandsurge,” which refers to significant short-term increases in building material and labor costs due to
a sharp increase in demand for those materials and services. Approximately $100 million of net favorable
prior year reserve development in 2006 resulted from a reduction in loss estimates for catastrophes
incurred in2005, primarily due to lower than expected additional living expense losses related to
Hurricane Katrina.
In 2005, claims and claim adjustment expenses included catastrophe losses of $547 million, compared
with $189 million in 2004. Catastrophe losses in both years were primarily the result of hurricanes. Net
favorable prior year reserve development in 2005 was $360 million, as described above, compared with net
favorable prior year reserve development of $378 million in 2004. In 2004, net favorable prioryear reserve
developmentin theHomeowners and Other line of business was driven by a significant decrease in the
number of claims, attributable to changes in the marketplace, including higher policy deductible levels and
fewer small-dollar claims. These changes resulted in a change in the historical loss development patterns.
Net favorable prior year reserve development in the Automobile line of business was driven by better than
expected frequency andseverity which is believed to have been caused by societal trends. In addition, both