Travelers 2006 Annual Report Download - page 191
Download and view the complete annual report
Please find page 191 of the 2006 Travelers annual report below. You can navigate through the pages in the report by either clicking on the pages listed below, or by using the keyword search tool below to find specific information within the annual report.-
 1
1 -
2
-
3
-
4
-
5
-
6
-
7
-
8
-
9
-
10
-
11
-
12
-
13
-
14
-
15
-
16
-
17
-
18
-
19
-
20
-
21
-
22
-
23
-
24
-
25
-
26
-
27
-
28
-
29
-
30
-
31
-
32
-
33
-
34
-
35
-
36
-
37
-
38
-
39
-
40
-
41
-
42
-
43
-
44
-
45
-
46
-
47
-
48
-
49
-
50
-
51
-
52
-
53
-
54
-
55
-
56
-
57
-
58
-
59
-
60
-
61
-
62
-
63
-
64
-
65
-
66
-
67
-
68
-
69
-
70
-
71
-
72
-
73
-
74
-
75
-
76
-
77
-
78
-
79
-
80
-
81
-
82
-
83
-
84
-
85
-
86
-
87
-
88
-
89
-
90
-
91
-
92
-
93
-
94
-
95
-
96
-
97
-
98
-
99
-
100
-
101
-
102
-
103
-
104
-
105
-
106
-
107
-
108
-
109
-
110
-
111
-
112
-
113
-
114
-
115
-
116
-
117
-
118
-
119
-
120
-
121
-
122
-
123
-
124
-
125
-
126
-
127
-
128
-
129
-
130
-
131
-
132
-
133
-
134
-
135
-
136
-
137
-
138
-
139
-
140
-
141
-
142
-
143
-
144
-
145
-
146
-
147
-
148
-
149
-
150
-
151
-
152
-
153
-
154
-
155
-
156
-
157
-
158
-
159
-
160
-
161
-
162
-
163
-
164
-
165
-
166
-
167
-
168
-
169
-
170
-
171
-
172
-
173
-
174
-
175
-
176
-
177
-
178
-
179
-
180
-
 181
181 -
 182
182 -
 183
183 -
 184
184 -
 185
185 -
 186
186 -
 187
187 -
 188
188 -
 189
189 -
 190
190 -
 191
191 -
 192
192 -
 193
193 -
 194
194 -
 195
195 -
 196
196 -
 197
197 -
 198
198 -
 199
199 -
 200
200 -
 201
201 -
202
-
203
-
204
-
205
-
206
-
207
-
208
-
209
-
210
-
211
-
212
-
213
-
214
-
215
-
216
-
217
-
218
-
219
-
220
-
221
-
222
-
223
-
224
-
225
-
226
-
227
-
228
-
229
-
230
-
231
-
232
-
233
-
234
-
235
-
236
-
237
-
238
-
239
-
240
-
241
-
242
-
243
-
244
-
245
-
246
-
247
-
248
-
249
-
250
-
251
-
252
-
253
-
254
-
255
-
256
-
257
-
258
-
259
-
260
-
261
-
262
-
263
-
264
-
265
-
266
-
267
-
268
-
269
-
270
-
271
-
272
-
273
-
274
-
275
-
276
-
277
-
278
-
279
-
280
-
281
-
282
-
283
-
284
-
285
 |
 |

THE TRAVELERS COMPANIES, INC. AND SUBSIDIARIES
NOTES TO CONSOLIDATED FINANCIAL STATEMENTS (Continued)
179
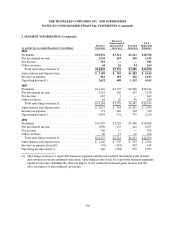
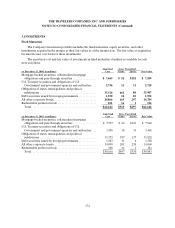
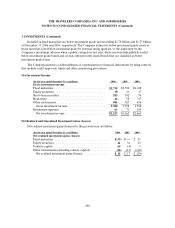
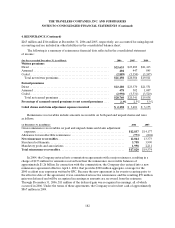
3. INVESTMENTS (Continued)
Less than 12 months 12 months or longer Total
(at December 31, 2005, in millions)
Fair
Value
Gross
Unrealized
Losses
Fair
Value
Gross
Unrealized
Losses
Fair
Value
Gross
Unrealized
Losses
Fixed maturities
Mortgage-backed securities,
collateralized mortgageobligations
andpass through securities........ $ 4,046 $ 62 $ 1,673 $ 59 $ 5,719 $121
U.S. Treasury securities and
obligations of U.S. Government
and government agencies and
authorities...................... 2,395 18576 17 2,971 35
Obligations of states, municipalities
and political subdivisions .........9,524 862,331 5111,855 137
Debt securities issued by foreign
governments.................... 547 4196 2 743 6
All other corporate bonds...........4,971 105 3,652 1258,623 230
Redeemable preferred stock ........ 5 —10 115 1
Total fixed maturities ............ 21,488 2758,438 255 29,926 530
Equity securities
Common stock.................... 101 14 2 24 3
Nonredeemablepreferred stock..... 37 130 3 67 4
Total equity securities............472 44 5917
Venture capital.................... 18 14 1 22 2
Total ........................... $ 21,553$ 2 78 $ 8,486$ 2 61 $ 30,039$ 5 39
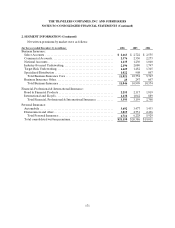
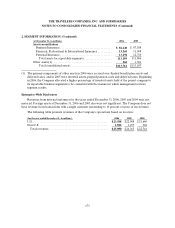
Impairment charges included in net realized investment gains (losses) were as follows:
(for the year ended December 31, in millions) 2006 2005 2004
Fixed maturities......................................... $ 7$ 11 $ 25
Equity securities. ........................................ 4— 5
Venture capital. ......................................... 33 80 40
Other investments (excluding venture capital)............... 418 10
Total ................................................ $ 48 $109 $80
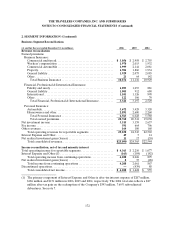
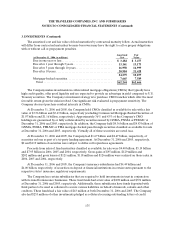
Concentrations andCredit Quality
At December 31, 2006 and 2005, the Company had concentrations of creditrisk in tax-exempt
investments of the state of Texas of $3.86 billion and $3.27 billion, respectively, of the state of California of
$2.10 billion and $1.54 billion, respectively, and of the state of Illinois of $1.93 billion and $1.84 billion,
respectively.