Travelers 2006 Annual Report Download - page 187
Download and view the complete annual report
Please find page 187 of the 2006 Travelers annual report below. You can navigate through the pages in the report by either clicking on the pages listed below, or by using the keyword search tool below to find specific information within the annual report.-
 1
1 -
2
-
3
-
4
-
5
-
6
-
7
-
8
-
9
-
10
-
11
-
12
-
13
-
14
-
15
-
16
-
17
-
18
-
19
-
20
-
21
-
22
-
23
-
24
-
25
-
26
-
27
-
28
-
29
-
30
-
31
-
32
-
33
-
34
-
35
-
36
-
37
-
38
-
39
-
40
-
41
-
42
-
43
-
44
-
45
-
46
-
47
-
48
-
49
-
50
-
51
-
52
-
53
-
54
-
55
-
56
-
57
-
58
-
59
-
60
-
61
-
62
-
63
-
64
-
65
-
66
-
67
-
68
-
69
-
70
-
71
-
72
-
73
-
74
-
75
-
76
-
77
-
78
-
79
-
80
-
81
-
82
-
83
-
84
-
85
-
86
-
87
-
88
-
89
-
90
-
91
-
92
-
93
-
94
-
95
-
96
-
97
-
98
-
99
-
100
-
101
-
102
-
103
-
104
-
105
-
106
-
107
-
108
-
109
-
110
-
111
-
112
-
113
-
114
-
115
-
116
-
117
-
118
-
119
-
120
-
121
-
122
-
123
-
124
-
125
-
126
-
127
-
128
-
129
-
130
-
131
-
132
-
133
-
134
-
135
-
136
-
137
-
138
-
139
-
140
-
141
-
142
-
143
-
144
-
145
-
146
-
147
-
148
-
149
-
150
-
151
-
152
-
153
-
154
-
155
-
156
-
157
-
158
-
159
-
160
-
161
-
162
-
163
-
164
-
165
-
166
-
167
-
168
-
169
-
170
-
171
-
172
-
173
-
174
-
175
-
176
-
 177
177 -
 178
178 -
 179
179 -
 180
180 -
 181
181 -
 182
182 -
 183
183 -
 184
184 -
 185
185 -
 186
186 -
 187
187 -
 188
188 -
 189
189 -
 190
190 -
 191
191 -
 192
192 -
 193
193 -
 194
194 -
 195
195 -
 196
196 -
 197
197 -
198
-
199
-
200
-
201
-
202
-
203
-
204
-
205
-
206
-
207
-
208
-
209
-
210
-
211
-
212
-
213
-
214
-
215
-
216
-
217
-
218
-
219
-
220
-
221
-
222
-
223
-
224
-
225
-
226
-
227
-
228
-
229
-
230
-
231
-
232
-
233
-
234
-
235
-
236
-
237
-
238
-
239
-
240
-
241
-
242
-
243
-
244
-
245
-
246
-
247
-
248
-
249
-
250
-
251
-
252
-
253
-
254
-
255
-
256
-
257
-
258
-
259
-
260
-
261
-
262
-
263
-
264
-
265
-
266
-
267
-
268
-
269
-
270
-
271
-
272
-
273
-
274
-
275
-
276
-
277
-
278
-
279
-
280
-
281
-
282
-
283
-
284
-
285
 |
 |

THE TRAVELERS COMPANIES, INC. AND SUBSIDIARIES
NOTES TO CONSOLIDATED FINANCIAL STATEMENTS (Continued)
175
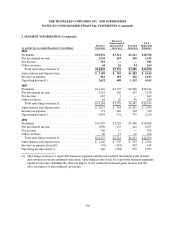
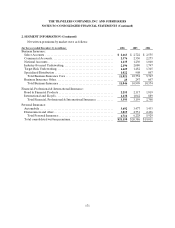
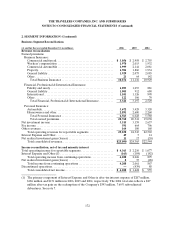
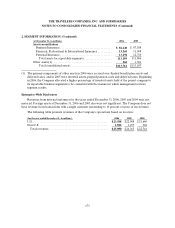
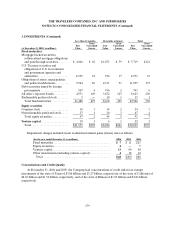
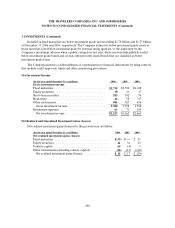
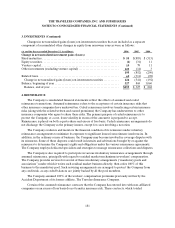
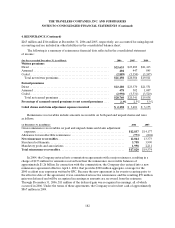
3. INVESTMENTS (Continued)
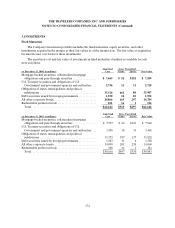
The amortized cost and fair value of fixed maturities by contractual maturity follow. Actual maturities
will differ from contractual maturities because borrowers may have the right to call or prepay obligations
with or without call or prepayment penalties.
(at December 31, 2006, in millions)
Amortized
Cost
Fair
Value
Due in one year or less....................................$ 3,484 $ 3,477
Due after1 yearthrough 5 years............................13,161 13,173
Due after5 years through 10years ..........................16,950 16,999
Due after10 years........................................20,984 21,428
54,579 55,077
Mortgage-backed securities................................7,665 7,589
Total .................................................$ 62,244$ 6 2,666
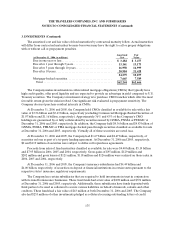
The Company makes investments in collateralized mortgage obligations (CMOs) that typically have
high credit quality, offer good liquidity and are expected to provide an advantage in yield compared to U.S.
Treasury securities. The Company’s investment strategy is to purchase CMO tranches which offer the most
favorable return given the risks involved. One significant risk evaluated is prepayment sensitivity. The
Company does not purchase residual interests in CMOs.
At December 31, 2006 and 2005, the Company held CMOs classified as available for sale with a fair
value of $3.56 billion and $3.43 billion, respectively (excluding Commercial Mortgage-Backed Securities of
$1.07 billion and $1.16 billion, respectively). Approximately 36% and 43% of the Company’s CMO
holdings are guaranteed byor fully collateralized by securities issued by GNMA, FNMA or FHLMC at
December 31, 2006 and 2005, respectively. In addition, the Company held $4.36 billion and $4.83 billion of
GNMA, FNMA, FHLMC or FHA mortgage-backed pass-through securities classified as available for sale
at December 31, 2006 and 2005, respectively. Virtually all of these securities are rated Aaa.
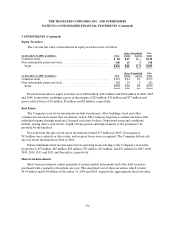
At December 31, 2006 and 2005, the Company had$1.67 billion and $2.67 billion, respectively, of
securities on loan as part of a tri-party lending agreement. At December 31, 2006 and 2005, respectively,
$0 and $119 million of securities were subject to dollar-roll repurchase agreements.
Proceeds from sales of fixed maturities classified as available for sale were $4.40 billion, $5.19 billion
and $7.95 billion in 2006, 2005 and2004, respectively. Gross gains of $95 million, $129million and
$202 million and gross losses of $121 million, $118 million and $126 million were realized on thosesales in
2006, 2005 and 2004, respectively.
At December 31, 2006 and 2005, the Company’s insurance subsidiaries had $4.44 billion and
$4.00 billion, respectively, of securities ondeposit at financial institutions in certain states pursuant to the
respective states’ insurance regulatory requirements.
The Company has certain subsidiaries that are required to hold investments in trust in conjunction
with its runoff reinsurance businesses. These trust funds had a fair value of$298 million and$374 million
at December 31, 2006 and 2005, respectively. Additionally, these subsidiaries have funds deposited with
third parties to be used as collateral to secure various liabilities on behalf of insureds, cedants and other
creditors. These funds had a fair value of $43 million at both December 31, 2006 and 2005. The Company
alsohad $253 million of other investments pledged as collateral securing outstanding letters of credit.