Travelers 2006 Annual Report Download - page 117
Download and view the complete annual report
Please find page 117 of the 2006 Travelers annual report below. You can navigate through the pages in the report by either clicking on the pages listed below, or by using the keyword search tool below to find specific information within the annual report.-
 1
1 -
2
-
3
-
4
-
5
-
6
-
7
-
8
-
9
-
10
-
11
-
12
-
13
-
14
-
15
-
16
-
17
-
18
-
19
-
20
-
21
-
22
-
23
-
24
-
25
-
26
-
27
-
28
-
29
-
30
-
31
-
32
-
33
-
34
-
35
-
36
-
37
-
38
-
39
-
40
-
41
-
42
-
43
-
44
-
45
-
46
-
47
-
48
-
49
-
50
-
51
-
52
-
53
-
54
-
55
-
56
-
57
-
58
-
59
-
60
-
61
-
62
-
63
-
64
-
65
-
66
-
67
-
68
-
69
-
70
-
71
-
72
-
73
-
74
-
75
-
76
-
77
-
78
-
79
-
80
-
81
-
82
-
83
-
84
-
85
-
86
-
87
-
88
-
89
-
90
-
91
-
92
-
93
-
94
-
95
-
96
-
97
-
98
-
99
-
100
-
101
-
102
-
103
-
104
-
105
-
106
-
 107
107 -
 108
108 -
 109
109 -
 110
110 -
 111
111 -
 112
112 -
 113
113 -
 114
114 -
 115
115 -
 116
116 -
 117
117 -
 118
118 -
 119
119 -
 120
120 -
 121
121 -
 122
122 -
 123
123 -
 124
124 -
 125
125 -
 126
126 -
 127
127 -
128
-
129
-
130
-
131
-
132
-
133
-
134
-
135
-
136
-
137
-
138
-
139
-
140
-
141
-
142
-
143
-
144
-
145
-
146
-
147
-
148
-
149
-
150
-
151
-
152
-
153
-
154
-
155
-
156
-
157
-
158
-
159
-
160
-
161
-
162
-
163
-
164
-
165
-
166
-
167
-
168
-
169
-
170
-
171
-
172
-
173
-
174
-
175
-
176
-
177
-
178
-
179
-
180
-
181
-
182
-
183
-
184
-
185
-
186
-
187
-
188
-
189
-
190
-
191
-
192
-
193
-
194
-
195
-
196
-
197
-
198
-
199
-
200
-
201
-
202
-
203
-
204
-
205
-
206
-
207
-
208
-
209
-
210
-
211
-
212
-
213
-
214
-
215
-
216
-
217
-
218
-
219
-
220
-
221
-
222
-
223
-
224
-
225
-
226
-
227
-
228
-
229
-
230
-
231
-
232
-
233
-
234
-
235
-
236
-
237
-
238
-
239
-
240
-
241
-
242
-
243
-
244
-
245
-
246
-
247
-
248
-
249
-
250
-
251
-
252
-
253
-
254
-
255
-
256
-
257
-
258
-
259
-
260
-
261
-
262
-
263
-
264
-
265
-
266
-
267
-
268
-
269
-
270
-
271
-
272
-
273
-
274
-
275
-
276
-
277
-
278
-
279
-
280
-
281
-
282
-
283
-
284
-
285
 |
 |

105
The specific circumstances that led to the impairments described above did not materially impact
other individual investments held during2006, 2005 or 2004. The Company continually evaluates current
developments in the market that have the potential to affect the valuation of the Company’s investments.
At December 31, 2006, the Company had no fixed maturities or equity securities available for sale for
which fair value was less than 80% of amortized cost or cost, respectively.
At December 31, 2006, non-investment grade securities comprised 2.9% of the Company’s fixed
income investment portfolio. Included in those categories at December 31, 2006 were securities in an
unrealized loss position that, in the aggregate,had an amortized cost of $599 million and a fair value of
$581 million, resulting in a net pretax unrealized investment loss of $18 million. These securities in an
unrealized loss position represented less than 1% of the total amortized cost and less than1% of the fair
value of the fixed income portfolio at December 31, 2006, and accounted for 4% of the total pretax
unrealized investment loss in the fixed income portfolio.
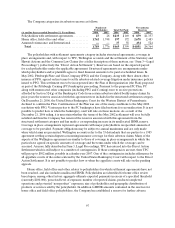
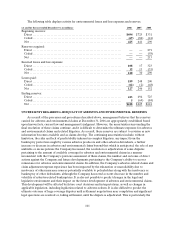
Following are the pretax realized losses on investments sold during the year ended
December 31, 2006:
(in millions) Loss Fair Value
Fixed maturities.............................................$ 121 $ 2,950
Equity securities. ............................................ 6 69
Other...................................................... 1 1
Total. ...................................................... $ 128 $ 3,020
Resulting purchases and sales of investments are basedon cash requirements, the characteristics of
the insurance liabilities and current marketconditions. The Company identifies investments to be sold to
achieve its primary investment goals of assuring the Company’s ability to meet policyholder obligations as
well as to optimize investment returns, given these obligations.
REINSURANCE RECOVERABLES
Ceded reinsurance involves credit risk, except with regard to mandatory pools, and is generally subject
to aggregate loss limits. Although the reinsurer is liable to the Company to the extent of the reinsurance
ceded, the Company remains liable as the direct insurer on all risks reinsured. Reinsurance recoverables
are reported after reductions for known insolvencies and after allowances for uncollectible amounts. The
Company also holds collateral, including trust agreements, escrow funds and letters of credit, under certain
reinsurance agreements. The Company monitors the financial condition of reinsurers on an ongoing basis
and reviews its reinsurance arrangements periodically. Reinsurers are selected based on their financial
condition, business practices and the price of their product offerings.
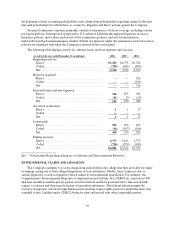
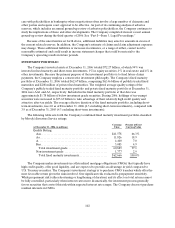
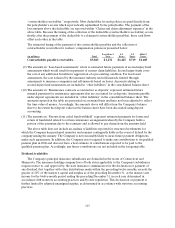
The following presents the Company’s topfive reinsurer groups, by reinsurance recoverables at
December 31, 2006 (in millions):
Reinsurer Group
Reinsurance
Recoverables A.M. Best Rating of Group’s Predominant Reinsurer
Swiss Re Group .......................... $1,478 A+ secondhighest of 16 ratings
Munich Re Group........................ 1,125A third highestof16 ratings
Berkshire Hathaway Group................ 900A++ highest of16 ratings
American International Group............. 718A+secondhighest of 16 ratings
XL Capital Group ........................ 552A+secondhighest of 16 ratings
At December 31, 2006, $3.30 billion of reinsurance recoverables were collateralized by letters of
credit, trust agreements and escrow funds.