Travelers 2006 Annual Report Download - page 17
Download and view the complete annual report
Please find page 17 of the 2006 Travelers annual report below. You can navigate through the pages in the report by either clicking on the pages listed below, or by using the keyword search tool below to find specific information within the annual report.-
 1
1 -
2
-
3
-
4
-
5
-
6
-
 7
7 -
 8
8 -
 9
9 -
 10
10 -
 11
11 -
 12
12 -
 13
13 -
 14
14 -
 15
15 -
 16
16 -
 17
17 -
 18
18 -
 19
19 -
 20
20 -
 21
21 -
 22
22 -
 23
23 -
 24
24 -
 25
25 -
 26
26 -
 27
27 -
28
-
29
-
30
-
31
-
32
-
33
-
34
-
35
-
36
-
37
-
38
-
39
-
40
-
41
-
42
-
43
-
44
-
45
-
46
-
47
-
48
-
49
-
50
-
51
-
52
-
53
-
54
-
55
-
56
-
57
-
58
-
59
-
60
-
61
-
62
-
63
-
64
-
65
-
66
-
67
-
68
-
69
-
70
-
71
-
72
-
73
-
74
-
75
-
76
-
77
-
78
-
79
-
80
-
81
-
82
-
83
-
84
-
85
-
86
-
87
-
88
-
89
-
90
-
91
-
92
-
93
-
94
-
95
-
96
-
97
-
98
-
99
-
100
-
101
-
102
-
103
-
104
-
105
-
106
-
107
-
108
-
109
-
110
-
111
-
112
-
113
-
114
-
115
-
116
-
117
-
118
-
119
-
120
-
121
-
122
-
123
-
124
-
125
-
126
-
127
-
128
-
129
-
130
-
131
-
132
-
133
-
134
-
135
-
136
-
137
-
138
-
139
-
140
-
141
-
142
-
143
-
144
-
145
-
146
-
147
-
148
-
149
-
150
-
151
-
152
-
153
-
154
-
155
-
156
-
157
-
158
-
159
-
160
-
161
-
162
-
163
-
164
-
165
-
166
-
167
-
168
-
169
-
170
-
171
-
172
-
173
-
174
-
175
-
176
-
177
-
178
-
179
-
180
-
181
-
182
-
183
-
184
-
185
-
186
-
187
-
188
-
189
-
190
-
191
-
192
-
193
-
194
-
195
-
196
-
197
-
198
-
199
-
200
-
201
-
202
-
203
-
204
-
205
-
206
-
207
-
208
-
209
-
210
-
211
-
212
-
213
-
214
-
215
-
216
-
217
-
218
-
219
-
220
-
221
-
222
-
223
-
224
-
225
-
226
-
227
-
228
-
229
-
230
-
231
-
232
-
233
-
234
-
235
-
236
-
237
-
238
-
239
-
240
-
241
-
242
-
243
-
244
-
245
-
246
-
247
-
248
-
249
-
250
-
251
-
252
-
253
-
254
-
255
-
256
-
257
-
258
-
259
-
260
-
261
-
262
-
263
-
264
-
265
-
266
-
267
-
268
-
269
-
270
-
271
-
272
-
273
-
274
-
275
-
276
-
277
-
278
-
279
-
280
-
281
-
282
-
283
-
284
-
285
 |
 |

5
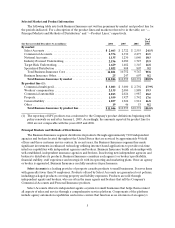
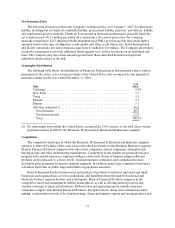
Selected Market and Product Information
The following table sets forth Business Insurancenet written premiums by market and product line for
the periods indicated. For a description of the product lines and markets referred to in the table, see “—
Principal Markets and Methods of Distribution” and “—Product Lines,” respectively.
(for the year ended December 31, in millions) 2006 2005 2004
% of
Total
2006
By market:
Select Accounts......................................... $ 2,663 $2,722 $2,555
24.1%
Commercial Accounts.................................... 2,376 2,330 2,273 21.5
National Accounts ....................................... 1,135 1,230 1,040 10.3
Industry-Focused Underwriting. ........................... 2,196 2,080 1,747 19.9
Target Risk Underwriting................................. 1,629 1,482 1,345 14.8
Specialized Distribution .................................. 1,022 908 807 9.2
Total Business Insurance Core.......................... 11,021 10,752 9,767 99.8
Business Insurance Other................................. 25 247 607 0.2
Total Business Insurance by market ..................... $ 1 1,046 $10,999 $ 1 0,374 100.0%
By product line (1):
Commercial multi-peril................................... $ 3,083 $3,000 $2,792
27.9%
Workers’ compensation.................................. 2,135 2,080 1,888 19.3
Commercial automobile .................................. 2,013 2,024 1,987 18.2
Property ................................................ 1,939 1,927 1,742 17.6
General liability......................................... 1,857 1,922 1,912 16.8
Other.................................................. 19 46 53
0.2
Total Business Insurance by product line ................. $ 1 1,046 $10,999 $ 1 0,374 100.0%
(1) The reporting of SPC products was conformed tothe Company’s product definitions beginning with
policy renewals on and after January 1, 2005. Accordingly, the amounts reported by product line for
2004 are not comparable with the years 2005 and 2006.
Principal Markets and Methods of Distribution
The BusinessInsurance segment distributes its products through approximately 7,100 independent
agencies andbrokers located throughout the UnitedStates that are serviced by approximately 90 field
offices and three customer service centers. In recent years, the Business Insurance segment has made
significant investments in enhanced technology utilizing internet-based applications to provide real-time
interface capabilities with independent agencies and brokers. Business Insurance builds relationships with
well-established, independent insurance agencies and brokers. In selecting new independent agencies and
brokers to distribute its products, Business Insurance considers each agency’s or broker’s profitability,
financial stability, staff experience and strategic fit with its operating and marketing plans. Once an agency
or broker is appointed, Business Insurance carefully monitors its performance.
Select Accounts is a leading provider of property casualty products to small businesses. It serves firms
with generally fewer than 50 employees. Products offered by Select Accounts are guaranteed cost policies,
including packaged products covering property and liability exposures. Products are sold through
independent agents and brokers, who are often thesame agents and brokers that sell the Company’s
Commercial Accounts and Personal Insurance products.
Select Accounts offers its independent agents a system for small businesses that helps them connect
all aspects of sales and service through a comprehensive service platform. Components of the platform
include agency automation capabilities and service centers that function as an extension of an agency’s