Travelers 2006 Annual Report Download - page 102
Download and view the complete annual report
Please find page 102 of the 2006 Travelers annual report below. You can navigate through the pages in the report by either clicking on the pages listed below, or by using the keyword search tool below to find specific information within the annual report.-
 1
1 -
2
-
3
-
4
-
5
-
6
-
7
-
8
-
9
-
10
-
11
-
12
-
13
-
14
-
15
-
16
-
17
-
18
-
19
-
20
-
21
-
22
-
23
-
24
-
25
-
26
-
27
-
28
-
29
-
30
-
31
-
32
-
33
-
34
-
35
-
36
-
37
-
38
-
39
-
40
-
41
-
42
-
43
-
44
-
45
-
46
-
47
-
48
-
49
-
50
-
51
-
52
-
53
-
54
-
55
-
56
-
57
-
58
-
59
-
60
-
61
-
62
-
63
-
64
-
65
-
66
-
67
-
68
-
69
-
70
-
71
-
72
-
73
-
74
-
75
-
76
-
77
-
78
-
79
-
80
-
81
-
82
-
83
-
84
-
85
-
86
-
87
-
88
-
89
-
90
-
91
-
 92
92 -
 93
93 -
 94
94 -
 95
95 -
 96
96 -
 97
97 -
 98
98 -
 99
99 -
 100
100 -
 101
101 -
 102
102 -
 103
103 -
 104
104 -
 105
105 -
 106
106 -
 107
107 -
 108
108 -
 109
109 -
 110
110 -
 111
111 -
 112
112 -
113
-
114
-
115
-
116
-
117
-
118
-
119
-
120
-
121
-
122
-
123
-
124
-
125
-
126
-
127
-
128
-
129
-
130
-
131
-
132
-
133
-
134
-
135
-
136
-
137
-
138
-
139
-
140
-
141
-
142
-
143
-
144
-
145
-
146
-
147
-
148
-
149
-
150
-
151
-
152
-
153
-
154
-
155
-
156
-
157
-
158
-
159
-
160
-
161
-
162
-
163
-
164
-
165
-
166
-
167
-
168
-
169
-
170
-
171
-
172
-
173
-
174
-
175
-
176
-
177
-
178
-
179
-
180
-
181
-
182
-
183
-
184
-
185
-
186
-
187
-
188
-
189
-
190
-
191
-
192
-
193
-
194
-
195
-
196
-
197
-
198
-
199
-
200
-
201
-
202
-
203
-
204
-
205
-
206
-
207
-
208
-
209
-
210
-
211
-
212
-
213
-
214
-
215
-
216
-
217
-
218
-
219
-
220
-
221
-
222
-
223
-
224
-
225
-
226
-
227
-
228
-
229
-
230
-
231
-
232
-
233
-
234
-
235
-
236
-
237
-
238
-
239
-
240
-
241
-
242
-
243
-
244
-
245
-
246
-
247
-
248
-
249
-
250
-
251
-
252
-
253
-
254
-
255
-
256
-
257
-
258
-
259
-
260
-
261
-
262
-
263
-
264
-
265
-
266
-
267
-
268
-
269
-
270
-
271
-
272
-
273
-
274
-
275
-
276
-
277
-
278
-
279
-
280
-
281
-
282
-
283
-
284
-
285
 |
 |

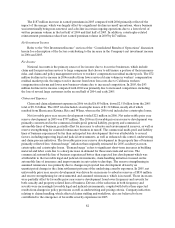
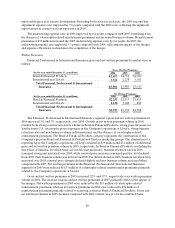
90
million of gross written premiums previously written in the Company’s Gulf operation (included in the
gross written premiums in2004.
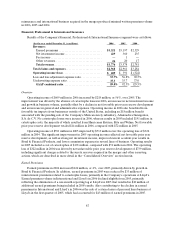
In Bond & Financial Products excluding surety, business retention rates in 2005 increased slightly over
previously, in the first quarter of 2005, the Company implemented changes in the timing and structure of
reinsurance purchased, which resulted in a slight increase in Financial, Professional &International
Insurance ceded premiums in 2005 over what would have been ceded prior to the changes being
implemented. In International in 2005, business retention rates increased, and new business volume
declined compared with 2004.
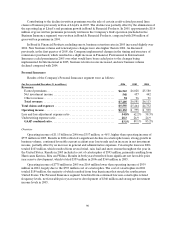
Personal Insurance
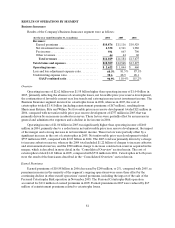
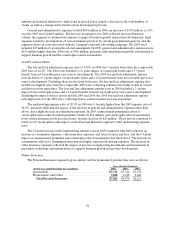
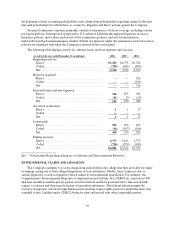
Results of the Company’s Personal Insurance segment were as follows:
(for the year ended December 31, in millions) 2006 2005 2004
Revenues:
Earned premiums................................................. $6,563
$6,028 $ 5 ,580
Net investment income............................................ 548 457 442
Other revenues ................................................... 94
96 91
Total revenues ................................................... $7,205
$6,581 $ 6 ,113
Total claims and expenses ........................................... $5,555
$5,464 $ 4 ,732
Operating income................................................... $1,132
$ 775 $ 939
Loss and loss adjustment expense ratio................................ 54.8% 62.2 % 58.3%
Underwriting expense ratio .......................................... 28.3 26.9 24.9
GAAP combined ratio ............................................. 83.1% 89.1 % 83.2%
Overview
Operating income of $1.13 billion in 2006 was $357 million, or 46%,higher than operating income of
$775 million in 2005. Results in 2006 reflected a significant decline in catastrophe losses, strong growth in
business volume, continued favorable current accident year loss trends and an increase in net investment
income, partially offset by an increase in general and administrative expenses. Catastrophe losses in 2006
totaled $103 million, which resulted from several wind, rain, hail and snow storms throughout the year in
the United States. Results in 2005 included a cost of catastrophes of$593 million, primarily resulting from
Hurricanes Katrina, Rita and Wilma. Results in bothyears benefited from significant net favorable prior
yearreservedevelopment,which totaled $359 million in 2006 and $360 million in 2005.
Operating income of $775million in 2005 was $164 million lower than operating income of $939
million in 2004, largely dueto the $593 million cost of catastrophes. The cost of catastrophes in 2004
totaled $189 million, the majority of which resulted from four hurricanes that struck the southeastern
United States. The Personal Insurance segment benefited from continued low non-catastrophe related
frequency levels, net favorable prior year reserve development of $360 million and strong net investment
income levels in 2005.
2004. New business volume and renewal price changes were also higher than in 2004. As discussed
the reporting lag at Lloyd’s and premium growth in Bond & Financial Products. In 2005, approximately $114
Contributing to the decline in written premiums was the sale of certain credit-related personal lines
Business Insurance segment) were written in Bond &Financial Products, compared with $90 million of
classes of business previously written at Lloyd’s in 2005. The decline was partially offset by the elimination of