Travelers 2006 Annual Report Download - page 85
Download and view the complete annual report
Please find page 85 of the 2006 Travelers annual report below. You can navigate through the pages in the report by either clicking on the pages listed below, or by using the keyword search tool below to find specific information within the annual report.-
 1
1 -
2
-
3
-
4
-
5
-
6
-
7
-
8
-
9
-
10
-
11
-
12
-
13
-
14
-
15
-
16
-
17
-
18
-
19
-
20
-
21
-
22
-
23
-
24
-
25
-
26
-
27
-
28
-
29
-
30
-
31
-
32
-
33
-
34
-
35
-
36
-
37
-
38
-
39
-
40
-
41
-
42
-
43
-
44
-
45
-
46
-
47
-
48
-
49
-
50
-
51
-
52
-
53
-
54
-
55
-
56
-
57
-
58
-
59
-
60
-
61
-
62
-
63
-
64
-
65
-
66
-
67
-
68
-
69
-
70
-
71
-
72
-
73
-
74
-
 75
75 -
 76
76 -
 77
77 -
 78
78 -
 79
79 -
 80
80 -
 81
81 -
 82
82 -
 83
83 -
 84
84 -
 85
85 -
 86
86 -
 87
87 -
 88
88 -
 89
89 -
 90
90 -
 91
91 -
 92
92 -
 93
93 -
 94
94 -
 95
95 -
96
-
97
-
98
-
99
-
100
-
101
-
102
-
103
-
104
-
105
-
106
-
107
-
108
-
109
-
110
-
111
-
112
-
113
-
114
-
115
-
116
-
117
-
118
-
119
-
120
-
121
-
122
-
123
-
124
-
125
-
126
-
127
-
128
-
129
-
130
-
131
-
132
-
133
-
134
-
135
-
136
-
137
-
138
-
139
-
140
-
141
-
142
-
143
-
144
-
145
-
146
-
147
-
148
-
149
-
150
-
151
-
152
-
153
-
154
-
155
-
156
-
157
-
158
-
159
-
160
-
161
-
162
-
163
-
164
-
165
-
166
-
167
-
168
-
169
-
170
-
171
-
172
-
173
-
174
-
175
-
176
-
177
-
178
-
179
-
180
-
181
-
182
-
183
-
184
-
185
-
186
-
187
-
188
-
189
-
190
-
191
-
192
-
193
-
194
-
195
-
196
-
197
-
198
-
199
-
200
-
201
-
202
-
203
-
204
-
205
-
206
-
207
-
208
-
209
-
210
-
211
-
212
-
213
-
214
-
215
-
216
-
217
-
218
-
219
-
220
-
221
-
222
-
223
-
224
-
225
-
226
-
227
-
228
-
229
-
230
-
231
-
232
-
233
-
234
-
235
-
236
-
237
-
238
-
239
-
240
-
241
-
242
-
243
-
244
-
245
-
246
-
247
-
248
-
249
-
250
-
251
-
252
-
253
-
254
-
255
-
256
-
257
-
258
-
259
-
260
-
261
-
262
-
263
-
264
-
265
-
266
-
267
-
268
-
269
-
270
-
271
-
272
-
273
-
274
-
275
-
276
-
277
-
278
-
279
-
280
-
281
-
282
-
283
-
284
-
285
 |
 |

73
each segment. The investment yield for investable funds reflects the duration of the loss reserves’ future
cash flows, the interest rate environment at the time the losses were incurred andA+ rated corporate debt
instrument yields. The investment yield for capital reflects the average yield on the total investment
portfolio. It is the application of the yields to the segments’ investable funds and capital that determines
the respective business segment’s share of actual net investment income.
Fee Income
The National Accounts market in the Business Insurance segment is the primary source of the
Company’s fee-based business. The declines in fee income in 2006and 2005 compared with the respective
prior years is described in the Business Insurance segment discussion that follows.
Net Realized Investment Gains (Losses)
Net pretax realized investment gains in 2006 totaled $11 million, compared with net pretax realized
investment gains of $17 million in 2005. The 2006 total included $49 million of net realized investment
gains (net of impairment losses of $33 million) generated by the venture capital portfolio and $30 million
of net realized investmentgains related to U.S. Treasury futures contracts (which require a daily mark-to-
market settlement and are used to shorten the duration of the Company’s fixed maturity investment
portfolio). These gains were substantially offset by $33 million of net realized investmentlosses from the
fixed maturity portfolio (including $7 million of impairment losses) and $22 million of net realized
investment losses related to the Company’s holdings of stock purchase warrants of Platinum Underwriters
Holdings, Ltd., a publicly-held company. In addition, the Company incurred net realized losses of $11
million related to the divestiture of two small subsidiaries.
Net pretax realized investment gains in 2005 were primarily generated from sales of venture capital
investments andequity securities. In addition, the Company realized a pretax gain of$21 million from the
sale of its Personal Catastrophe Risk operationand $13 million of pretax net gains related to U.S. Treasury
futures contracts. Net realized investment gains in 2005 were reduced by $109 million of impairment losses,
which were concentrated inthe venture capital portfolio as described in more detail later in this discussion.
The Company’s net pretax realized investment losses of $39 million in 2004 included impairment charges
totaling $80million. Net pretax realized investment gains (losses) in 2004 also included net losses of
$44 million related to U.S. Treasury futures contracts.
Further information regarding the nature of impairment charges in each year is included in the
“Investment Portfolio Management” section later in this discussion.
Other Revenues
Other revenues in all periods presented primarily consist of premium installment charges. In addition,
other revenues in 2006 included a $42 million gain on the redemptionof the Company’s $593 million,
7.60% subordinated debentures.
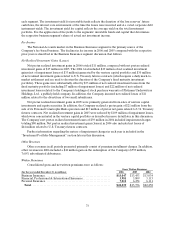
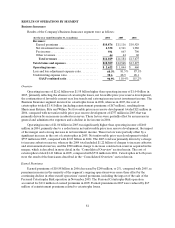
Written Premiums
Consolidated gross and net written premiums were as follows:
Gross Written Premiums
(for the year ended December 31, in millions) 2006 2005 2004
Business Insurance............................................... $ 13,047 $ 13,453 $ 13,034
Financial, Professional & International Insurance.................... 3,9813,809 3,113
Personal Insurance............................................... 7,0116,474 6,111
Total ......................................................... $ 24,039 $ 23,736 $ 22,258