Travelers 2006 Annual Report Download - page 14
Download and view the complete annual report
Please find page 14 of the 2006 Travelers annual report below. You can navigate through the pages in the report by either clicking on the pages listed below, or by using the keyword search tool below to find specific information within the annual report.-
 1
1 -
2
-
3
-
 4
4 -
 5
5 -
 6
6 -
 7
7 -
 8
8 -
 9
9 -
 10
10 -
 11
11 -
 12
12 -
 13
13 -
 14
14 -
 15
15 -
 16
16 -
 17
17 -
 18
18 -
 19
19 -
 20
20 -
 21
21 -
 22
22 -
 23
23 -
 24
24 -
25
-
26
-
27
-
28
-
29
-
30
-
31
-
32
-
33
-
34
-
35
-
36
-
37
-
38
-
39
-
40
-
41
-
42
-
43
-
44
-
45
-
46
-
47
-
48
-
49
-
50
-
51
-
52
-
53
-
54
-
55
-
56
-
57
-
58
-
59
-
60
-
61
-
62
-
63
-
64
-
65
-
66
-
67
-
68
-
69
-
70
-
71
-
72
-
73
-
74
-
75
-
76
-
77
-
78
-
79
-
80
-
81
-
82
-
83
-
84
-
85
-
86
-
87
-
88
-
89
-
90
-
91
-
92
-
93
-
94
-
95
-
96
-
97
-
98
-
99
-
100
-
101
-
102
-
103
-
104
-
105
-
106
-
107
-
108
-
109
-
110
-
111
-
112
-
113
-
114
-
115
-
116
-
117
-
118
-
119
-
120
-
121
-
122
-
123
-
124
-
125
-
126
-
127
-
128
-
129
-
130
-
131
-
132
-
133
-
134
-
135
-
136
-
137
-
138
-
139
-
140
-
141
-
142
-
143
-
144
-
145
-
146
-
147
-
148
-
149
-
150
-
151
-
152
-
153
-
154
-
155
-
156
-
157
-
158
-
159
-
160
-
161
-
162
-
163
-
164
-
165
-
166
-
167
-
168
-
169
-
170
-
171
-
172
-
173
-
174
-
175
-
176
-
177
-
178
-
179
-
180
-
181
-
182
-
183
-
184
-
185
-
186
-
187
-
188
-
189
-
190
-
191
-
192
-
193
-
194
-
195
-
196
-
197
-
198
-
199
-
200
-
201
-
202
-
203
-
204
-
205
-
206
-
207
-
208
-
209
-
210
-
211
-
212
-
213
-
214
-
215
-
216
-
217
-
218
-
219
-
220
-
221
-
222
-
223
-
224
-
225
-
226
-
227
-
228
-
229
-
230
-
231
-
232
-
233
-
234
-
235
-
236
-
237
-
238
-
239
-
240
-
241
-
242
-
243
-
244
-
245
-
246
-
247
-
248
-
249
-
250
-
251
-
252
-
253
-
254
-
255
-
256
-
257
-
258
-
259
-
260
-
261
-
262
-
263
-
264
-
265
-
266
-
267
-
268
-
269
-
270
-
271
-
272
-
273
-
274
-
275
-
276
-
277
-
278
-
279
-
280
-
281
-
282
-
283
-
284
-
285
 |
 |

2
based on many factors, including premiums charged; contract terms and conditions; products and services
offered; claim service; agent, broker and client relationships; ratings assigned by independent rating
agencies; local presence; geographic scope of business; overall financial strength; qualifications of
employees; and technology and information systems.
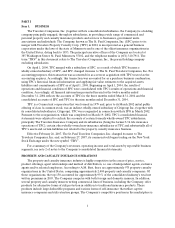
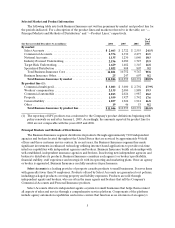
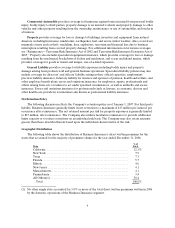
Geographic Distribution
The following table shows the distribution of the Company’s consolidated direct written premiums for
the year ended December 31, 2006:
State
% of
Total
New York ................................................................... 9.7%
California. ................................................................... 8.7
Texas....................................................................... 7.3
Florida...................................................................... 5.5
Pennsylvania ................................................................. 4.6
Massachusetts................................................................ 4.4
New Jersey .................................................................. 4.3
Illinois ...................................................................... 3.7
Georgia..................................................................... 3.1
Virginia ..................................................................... 3.0
All other domestic(1) ......................................................... 38.6
Total domestic ............................................................. 92.9
International................................................................. 7.1
Consolidated total.......................................................... 100.0%
(1) No other single state accounted for 3.0% or moreof the total direct written premiums written in 2006
by the Company’s domestic operations.
In August 2006, the Company announced a realignment of two of its three reportable business
segments. The former Commercial and Specialty segments were realigned into two new reportable
segments: the Business Insurance segment and the Financial, Professional & International Insurance
segment. The Personal segment was renamed Personal Insurance. The changes were designed to reflect
the manner in which the Company’s businesses are currently managed and represent an aggregation of
products and services based on type of customer, how the business is marketed, and the manner in which
risks are underwritten.
The following discussion of the Company’s reportable business segments reflects the realigned
segment reporting structure. Financial data for all prior periods presented was reclassified to be consistent
with the 2006 presentation.
BUSINESS INSURANCE
The BusinessInsurance segment offers a broad array of property and casualty insurance and
insurance-related services to its clients primarily in the United States. Business Insurance is organized into
the following six groups, which collectively comprise Business Insurance Core operations:
•Select Accounts serves small businesses for property and casualty products, including commercial
multi-peril, property, general liability, commercial auto and workers’ compensation insurance.
•Commercial Accounts serves primarily mid-sized businesses for property and casualty products,
including property, general liability, commercial multi-peril, commercial auto and workers’
compensation insurance. Certain units included in Commercial Accounts prior to the realignment