Travelers 2006 Annual Report Download - page 181
Download and view the complete annual report
Please find page 181 of the 2006 Travelers annual report below. You can navigate through the pages in the report by either clicking on the pages listed below, or by using the keyword search tool below to find specific information within the annual report.-
 1
1 -
2
-
3
-
4
-
5
-
6
-
7
-
8
-
9
-
10
-
11
-
12
-
13
-
14
-
15
-
16
-
17
-
18
-
19
-
20
-
21
-
22
-
23
-
24
-
25
-
26
-
27
-
28
-
29
-
30
-
31
-
32
-
33
-
34
-
35
-
36
-
37
-
38
-
39
-
40
-
41
-
42
-
43
-
44
-
45
-
46
-
47
-
48
-
49
-
50
-
51
-
52
-
53
-
54
-
55
-
56
-
57
-
58
-
59
-
60
-
61
-
62
-
63
-
64
-
65
-
66
-
67
-
68
-
69
-
70
-
71
-
72
-
73
-
74
-
75
-
76
-
77
-
78
-
79
-
80
-
81
-
82
-
83
-
84
-
85
-
86
-
87
-
88
-
89
-
90
-
91
-
92
-
93
-
94
-
95
-
96
-
97
-
98
-
99
-
100
-
101
-
102
-
103
-
104
-
105
-
106
-
107
-
108
-
109
-
110
-
111
-
112
-
113
-
114
-
115
-
116
-
117
-
118
-
119
-
120
-
121
-
122
-
123
-
124
-
125
-
126
-
127
-
128
-
129
-
130
-
131
-
132
-
133
-
134
-
135
-
136
-
137
-
138
-
139
-
140
-
141
-
142
-
143
-
144
-
145
-
146
-
147
-
148
-
149
-
150
-
151
-
152
-
153
-
154
-
155
-
156
-
157
-
158
-
159
-
160
-
161
-
162
-
163
-
164
-
165
-
166
-
167
-
168
-
169
-
170
-
 171
171 -
 172
172 -
 173
173 -
 174
174 -
 175
175 -
 176
176 -
 177
177 -
 178
178 -
 179
179 -
 180
180 -
 181
181 -
 182
182 -
 183
183 -
 184
184 -
 185
185 -
 186
186 -
 187
187 -
 188
188 -
 189
189 -
 190
190 -
 191
191 -
192
-
193
-
194
-
195
-
196
-
197
-
198
-
199
-
200
-
201
-
202
-
203
-
204
-
205
-
206
-
207
-
208
-
209
-
210
-
211
-
212
-
213
-
214
-
215
-
216
-
217
-
218
-
219
-
220
-
221
-
222
-
223
-
224
-
225
-
226
-
227
-
228
-
229
-
230
-
231
-
232
-
233
-
234
-
235
-
236
-
237
-
238
-
239
-
240
-
241
-
242
-
243
-
244
-
245
-
246
-
247
-
248
-
249
-
250
-
251
-
252
-
253
-
254
-
255
-
256
-
257
-
258
-
259
-
260
-
261
-
262
-
263
-
264
-
265
-
266
-
267
-
268
-
269
-
270
-
271
-
272
-
273
-
274
-
275
-
276
-
277
-
278
-
279
-
280
-
281
-
282
-
283
-
284
-
285
 |
 |
THE TRAVELERS COMPANIES, INC. AND SUBSIDIARIES
NOTES TO CONSOLIDATED FINANCIAL STATEMENTS (Continued)
169
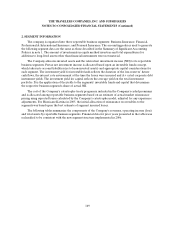
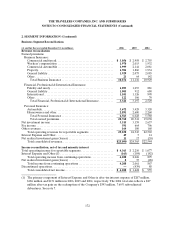
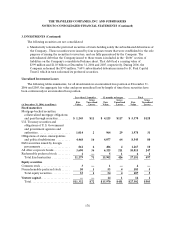
2. SEGMENT INFORMATION
The company is organized into three reportable business segments: Business Insurance; Financial,
Professional & International Insurance; and PersonalInsurance. The accountingpolicies used to generate
the following segment data are the same as those described in the Summary of SignificantAccounting
Policies in note 1. The amount of investments in equity method investees and total expenditures for
additions to long-lived assets other than financial instruments were not material.
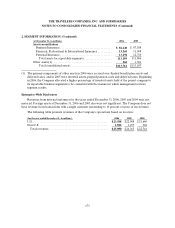
The Company allocates invested assets and the related net investment income (NII) to its reportable
business segments. Pretax net investment income is allocated based upon an investable funds concept,
which takes into account liabilities (netof non-investedassets) and appropriate capital considerations for
each segment. The investment yield for investable funds reflects the duration of the loss reserves’ future
cash flows, the interest rate environment at the time the losses were incurred andA+ rated corporate debt
instrument yields. The investment yield for capital reflects the average yield on the total investment
portfolio. It is the application of the yields to the segments’ investable funds and capital that determines
the respective business segment’s share of actual NII.
The cost of the Company’s catastrophe treaty program is included in the Company’s ceded premiums
and is allocated among reportable business segments based on an estimate of actual market reinsurance
pricing using expected losses calculated by the Company’s catastrophe model, adjusted for any experience
adjustments. For Hurricane Katrina in 2005, the initial allocation of reinsurance recoverables to the
segments was based upon the best estimate of segment incurred losses.
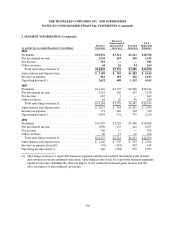
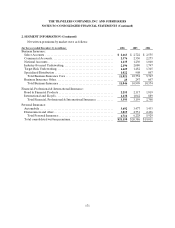
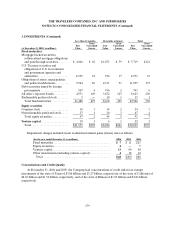
The following tables summarize the components of theCompany’s revenues, operating income (loss)
and total assets by reportable business segments. Financial data for prior years presented in the tables was
reclassified to be consistent with the new segment structure implemented in 2006.