Travelers 2006 Annual Report Download - page 232
Download and view the complete annual report
Please find page 232 of the 2006 Travelers annual report below. You can navigate through the pages in the report by either clicking on the pages listed below, or by using the keyword search tool below to find specific information within the annual report.-
 1
1 -
2
-
3
-
4
-
5
-
6
-
7
-
8
-
9
-
10
-
11
-
12
-
13
-
14
-
15
-
16
-
17
-
18
-
19
-
20
-
21
-
22
-
23
-
24
-
25
-
26
-
27
-
28
-
29
-
30
-
31
-
32
-
33
-
34
-
35
-
36
-
37
-
38
-
39
-
40
-
41
-
42
-
43
-
44
-
45
-
46
-
47
-
48
-
49
-
50
-
51
-
52
-
53
-
54
-
55
-
56
-
57
-
58
-
59
-
60
-
61
-
62
-
63
-
64
-
65
-
66
-
67
-
68
-
69
-
70
-
71
-
72
-
73
-
74
-
75
-
76
-
77
-
78
-
79
-
80
-
81
-
82
-
83
-
84
-
85
-
86
-
87
-
88
-
89
-
90
-
91
-
92
-
93
-
94
-
95
-
96
-
97
-
98
-
99
-
100
-
101
-
102
-
103
-
104
-
105
-
106
-
107
-
108
-
109
-
110
-
111
-
112
-
113
-
114
-
115
-
116
-
117
-
118
-
119
-
120
-
121
-
122
-
123
-
124
-
125
-
126
-
127
-
128
-
129
-
130
-
131
-
132
-
133
-
134
-
135
-
136
-
137
-
138
-
139
-
140
-
141
-
142
-
143
-
144
-
145
-
146
-
147
-
148
-
149
-
150
-
151
-
152
-
153
-
154
-
155
-
156
-
157
-
158
-
159
-
160
-
161
-
162
-
163
-
164
-
165
-
166
-
167
-
168
-
169
-
170
-
171
-
172
-
173
-
174
-
175
-
176
-
177
-
178
-
179
-
180
-
181
-
182
-
183
-
184
-
185
-
186
-
187
-
188
-
189
-
190
-
191
-
192
-
193
-
194
-
195
-
196
-
197
-
198
-
199
-
200
-
201
-
202
-
203
-
204
-
205
-
206
-
207
-
208
-
209
-
210
-
211
-
212
-
213
-
214
-
215
-
216
-
217
-
218
-
219
-
220
-
221
-
 222
222 -
 223
223 -
 224
224 -
 225
225 -
 226
226 -
 227
227 -
 228
228 -
 229
229 -
 230
230 -
 231
231 -
 232
232 -
 233
233 -
 234
234 -
 235
235 -
 236
236 -
 237
237 -
 238
238 -
 239
239 -
 240
240 -
 241
241 -
 242
242 -
243
-
244
-
245
-
246
-
247
-
248
-
249
-
250
-
251
-
252
-
253
-
254
-
255
-
256
-
257
-
258
-
259
-
260
-
261
-
262
-
263
-
264
-
265
-
266
-
267
-
268
-
269
-
270
-
271
-
272
-
273
-
274
-
275
-
276
-
277
-
278
-
279
-
280
-
281
-
282
-
283
-
284
-
285
 |
 |
THE TRAVELERS COMPANIES, INC. AND SUBSIDIARIES
NOTES TO CONSOLIDATED FINANCIAL STATEMENTS (Continued)
220
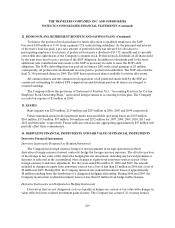
14. DERIVATIVE FINANCIAL INSTRUMENTS AND FAIR VALUE OF FINANCIAL INSTRUMENTS
(Continued)
contracts andforeign currency forward contracts, which are not designated ashedges at December 31,
2006 and 2005.
The Company engaged in U.S. Treasury note futures transactions to modify the duration of specific
assets within the investment portfolio. The Company enters into 90-day futures contracts on 2-year, 5-year,
10-year and 30-year U.S. Treasury notes which require a daily mark-to-market settlement with the broker.
The notional value of the open U.S.Treasury futures contracts was $350million and $1.20 billion at
December 31, 2006 and 2005, respectively. These derivative instruments are not designated and do not
qualify as hedges under FAS 133 and as such thedaily mark-to-market changes in fair value are reflected
in net realized investment gains (losses). Net realizedinvestment gains in 2006 and 2005 included net gains
of $30 million and $13 million, respectively, related to U.S. Treasury futures contracts which are settled
daily.
The Company owns six million stock purchase warrants of Platinum Underwriters Holdings, Ltd., a
publicly-held company. These warrants are not designated and do not qualify as hedges under FAS133
and as such the mark-to-market changes in fair value are reflected in net realized investment gains (losses).
In 2006 and2005, the Company recorded a net realized investment loss of $22 million and a net realized
investment gain of $7 million, respectively, related to the Company’s holdings of stock purchase warrants
of Platinum Underwriters Holdings, Ltd.
The Company purchases investments that have embedded derivatives, primarily convertible debt
securities. Theseembedded derivatives are carried at fair value with changes in value reflected in net
realized investment gains (losses). Derivatives embedded in convertible debt securities are reported on a
combined basis with their host instrument and are classified as fixed maturity securities.
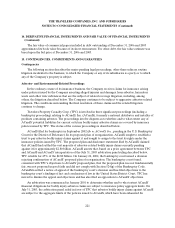
Fair Value of Financial Instruments
The Company uses various financial instruments in the normal course of its business. The Company’s
insurance contracts are excluded by FAS 107, Disclosures about Fair Value of Financial Instruments, and,
therefore, are not included in the amounts discussed.
At December 31, 2006 and 2005, investments in fixed maturities had a fair value, which equaled
carrying value, of $62.67 billion and $58.98 billion, respectively. The fair value of investments in fixed
maturities for which a quoted market price or dealer quote are not available was $547 million and
$456 million at December 31, 2006 and 2005, respectively. See note 1.
The carrying values of cash, short-term securities, mortgage loans and investmentincome accrued
approximated their fair values. See notes 1and 3.
The carrying values of $876 million and $1.11 billion of financial instruments classified as other assets
approximated their fair values at December 31, 2006 and2005, respectively. The carrying values of
$5.15 billion and$5.33 billion of financial instruments classified as other liabilities at December 31, 2006
and 2005, respectively, also approximated their fair values. Fair value is determined using various methods
including discounted cash flows, as appropriate for the various financial instruments.
The carrying value and fair value of the Company’sdebt at December 31, 2006 was $5.76 billion and
$5.98 billion, respectively. The respective totals at December 31, 2005 were $5.85 billion and $5.82 billion.