Travelers 2006 Annual Report Download - page 100
Download and view the complete annual report
Please find page 100 of the 2006 Travelers annual report below. You can navigate through the pages in the report by either clicking on the pages listed below, or by using the keyword search tool below to find specific information within the annual report.-
 1
1 -
2
-
3
-
4
-
5
-
6
-
7
-
8
-
9
-
10
-
11
-
12
-
13
-
14
-
15
-
16
-
17
-
18
-
19
-
20
-
21
-
22
-
23
-
24
-
25
-
26
-
27
-
28
-
29
-
30
-
31
-
32
-
33
-
34
-
35
-
36
-
37
-
38
-
39
-
40
-
41
-
42
-
43
-
44
-
45
-
46
-
47
-
48
-
49
-
50
-
51
-
52
-
53
-
54
-
55
-
56
-
57
-
58
-
59
-
60
-
61
-
62
-
63
-
64
-
65
-
66
-
67
-
68
-
69
-
70
-
71
-
72
-
73
-
74
-
75
-
76
-
77
-
78
-
79
-
80
-
81
-
82
-
83
-
84
-
85
-
86
-
87
-
88
-
89
-
 90
90 -
 91
91 -
 92
92 -
 93
93 -
 94
94 -
 95
95 -
 96
96 -
 97
97 -
 98
98 -
 99
99 -
 100
100 -
 101
101 -
 102
102 -
 103
103 -
 104
104 -
 105
105 -
 106
106 -
 107
107 -
 108
108 -
 109
109 -
 110
110 -
111
-
112
-
113
-
114
-
115
-
116
-
117
-
118
-
119
-
120
-
121
-
122
-
123
-
124
-
125
-
126
-
127
-
128
-
129
-
130
-
131
-
132
-
133
-
134
-
135
-
136
-
137
-
138
-
139
-
140
-
141
-
142
-
143
-
144
-
145
-
146
-
147
-
148
-
149
-
150
-
151
-
152
-
153
-
154
-
155
-
156
-
157
-
158
-
159
-
160
-
161
-
162
-
163
-
164
-
165
-
166
-
167
-
168
-
169
-
170
-
171
-
172
-
173
-
174
-
175
-
176
-
177
-
178
-
179
-
180
-
181
-
182
-
183
-
184
-
185
-
186
-
187
-
188
-
189
-
190
-
191
-
192
-
193
-
194
-
195
-
196
-
197
-
198
-
199
-
200
-
201
-
202
-
203
-
204
-
205
-
206
-
207
-
208
-
209
-
210
-
211
-
212
-
213
-
214
-
215
-
216
-
217
-
218
-
219
-
220
-
221
-
222
-
223
-
224
-
225
-
226
-
227
-
228
-
229
-
230
-
231
-
232
-
233
-
234
-
235
-
236
-
237
-
238
-
239
-
240
-
241
-
242
-
243
-
244
-
245
-
246
-
247
-
248
-
249
-
250
-
251
-
252
-
253
-
254
-
255
-
256
-
257
-
258
-
259
-
260
-
261
-
262
-
263
-
264
-
265
-
266
-
267
-
268
-
269
-
270
-
271
-
272
-
273
-
274
-
275
-
276
-
277
-
278
-
279
-
280
-
281
-
282
-
283
-
284
-
285
 |
 |
88
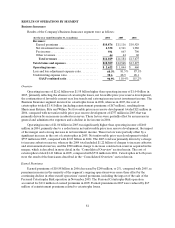
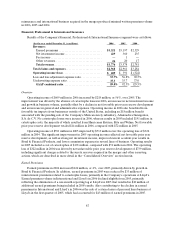
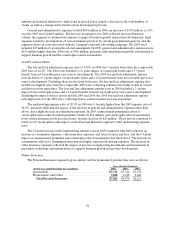
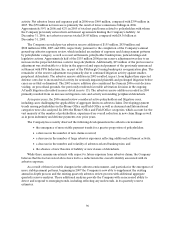
Earned premiums in 2005 increased $668 million, or 26%, over2004, primarily reflecting the impact
of the merger. Earned premiums in 2005 were reduced by $33 million in catastrophe-related reinstatement
premiums. Earned premiums in 2005 also reflected the inclusion of one additional month of premium
volume to eliminate a reporting lag at the Company’s operations at Lloyd’s, the impact of which was
partially offset by the sale of certain classes of personal insurance business at those Lloyd’s operations.
Earned premiums in 2004 were reduced by $76 million of reinstatement premiums primarily related to a
reserve charge inBond & Financial Products.
Net Investment Income
Refer to the “Net Investment Income” section of the “Consolidated Results of Operations” discussion
herein for a description of the factors contributing to the increase in the Company’s net investment income
in 2006 and 2005.
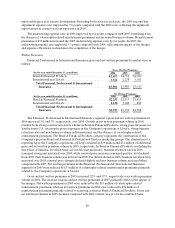
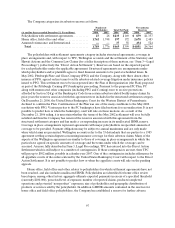
Claims and Expenses
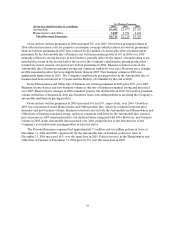
Claims and claims adjustment expenses in 2006 totaled $1.79 billion, compared with $1.82 billion
during the same period of 2005. The 2006 total included no catastrophe losses and $14 million of net
favorable prior year reserve development, whereas the2005 total included $158 million of catastrophe
losses and $72 million of net favorable prior year reserve development. Net favorable prior year reserve
developmentin2005 was attributable to the better than anticipated favorable impact from changes in
underwriting and pricing strategies for International property-related exposures.
Claim and claim adjustment expenses totaled $1.82 billion in 2005, down significantly from the 2004
total of $2.35 billion. The 2005 total included $158 million of catastrophe losses, compared with $40 million
of catastrophe costs recorded in 2004. Catastrophe losses in both periods were driven by the hurricanes
described previously. Net favorable prior year reserve development in 2005 of $72 million was driven by
International. Net unfavorable prior year reserve development totaled $739 million in 2004, which
included the $300 million charge to increase the estimate of the acquired net surety reserves in Bond &
Financial Products, and the $252 million charge relatedto the financial condition of a specific construction
contractor, both of which are described in moredetail in the “Consolidated Overview” section herein.
Results in 2004 also reflected a $60 million reserve increase related to the commutation of agreements
with a major reinsurer, a charge to increase the allowance for estimated uncollectible amounts due from a
co-surety on a specific construction contractor claim, and increased current year loss ratios on portions of
the Bond & Financial Products book of business.
General and administrative expenses in 2006 totaled $536 million, an increase of 5% over 2005. The
increase in 2006 primarily reflected the segment’s expenditures to support business growth and the
segment’s share of costs associated with the Company’s national advertising campaign and legal expenses
related to investigations of various business practices by certain governmental agencies. General and
administrative expenses in 2005 totaled $509 million, an increase of 26% over the 2004 total of $405
million which primarily reflected the impact of the merger. The 2005 total included the impacts of a
decline in commission expenses and expense efficienciesrealized asa result of the merger.
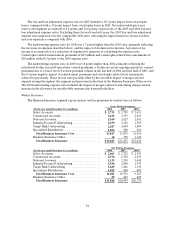
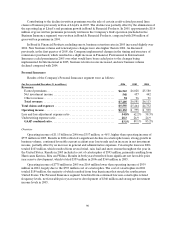
GAAP Combined Ratio
The loss and loss adjustment expense ratio of 53.7% in 2006 was 3.1 points lower than the ratio of
56.8% in 2005. The 2006 ratio included no impact of catastrophe losses and a 0.4 point benefit from net
favorable prior year reserve development, whereas the 2005 ratio included a 5.5 point impact from
catastrophes and a 2.3 point benefit from net favorable prior year reserve development. Excluding those
factors in each year, the 2006 ratio was slightly higher than the 2005 ratio. The loss and loss adjustment
expense ratio in 2004 included a 2.0 point impact from catastrophe losses, and a 29.3 point impact from net