Travelers 2006 Annual Report Download - page 83
Download and view the complete annual report
Please find page 83 of the 2006 Travelers annual report below. You can navigate through the pages in the report by either clicking on the pages listed below, or by using the keyword search tool below to find specific information within the annual report.-
 1
1 -
2
-
3
-
4
-
5
-
6
-
7
-
8
-
9
-
10
-
11
-
12
-
13
-
14
-
15
-
16
-
17
-
18
-
19
-
20
-
21
-
22
-
23
-
24
-
25
-
26
-
27
-
28
-
29
-
30
-
31
-
32
-
33
-
34
-
35
-
36
-
37
-
38
-
39
-
40
-
41
-
42
-
43
-
44
-
45
-
46
-
47
-
48
-
49
-
50
-
51
-
52
-
53
-
54
-
55
-
56
-
57
-
58
-
59
-
60
-
61
-
62
-
63
-
64
-
65
-
66
-
67
-
68
-
69
-
70
-
71
-
72
-
 73
73 -
 74
74 -
 75
75 -
 76
76 -
 77
77 -
 78
78 -
 79
79 -
 80
80 -
 81
81 -
 82
82 -
 83
83 -
 84
84 -
 85
85 -
 86
86 -
 87
87 -
 88
88 -
 89
89 -
 90
90 -
 91
91 -
 92
92 -
 93
93 -
94
-
95
-
96
-
97
-
98
-
99
-
100
-
101
-
102
-
103
-
104
-
105
-
106
-
107
-
108
-
109
-
110
-
111
-
112
-
113
-
114
-
115
-
116
-
117
-
118
-
119
-
120
-
121
-
122
-
123
-
124
-
125
-
126
-
127
-
128
-
129
-
130
-
131
-
132
-
133
-
134
-
135
-
136
-
137
-
138
-
139
-
140
-
141
-
142
-
143
-
144
-
145
-
146
-
147
-
148
-
149
-
150
-
151
-
152
-
153
-
154
-
155
-
156
-
157
-
158
-
159
-
160
-
161
-
162
-
163
-
164
-
165
-
166
-
167
-
168
-
169
-
170
-
171
-
172
-
173
-
174
-
175
-
176
-
177
-
178
-
179
-
180
-
181
-
182
-
183
-
184
-
185
-
186
-
187
-
188
-
189
-
190
-
191
-
192
-
193
-
194
-
195
-
196
-
197
-
198
-
199
-
200
-
201
-
202
-
203
-
204
-
205
-
206
-
207
-
208
-
209
-
210
-
211
-
212
-
213
-
214
-
215
-
216
-
217
-
218
-
219
-
220
-
221
-
222
-
223
-
224
-
225
-
226
-
227
-
228
-
229
-
230
-
231
-
232
-
233
-
234
-
235
-
236
-
237
-
238
-
239
-
240
-
241
-
242
-
243
-
244
-
245
-
246
-
247
-
248
-
249
-
250
-
251
-
252
-
253
-
254
-
255
-
256
-
257
-
258
-
259
-
260
-
261
-
262
-
263
-
264
-
265
-
266
-
267
-
268
-
269
-
270
-
271
-
272
-
273
-
274
-
275
-
276
-
277
-
278
-
279
-
280
-
281
-
282
-
283
-
284
-
285
 |
 |
71
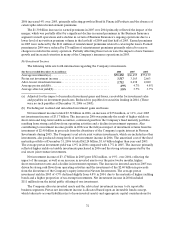
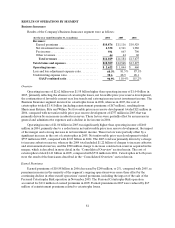
year reserve development, strong growth in investment income and higher business volume. These factors
were partially offset by an increaseingeneral and administrative expenses and a decline in fee income.
Catastrophe losses in 2006 totaled $103 million, primarily resulting from several wind, rain, hail andsnow
storms in the United States, whereas results in 2005 included $2.19 billion of catastrophe costs, primarily
resulting from Hurricanes Katrina, Rita and Wilma. Net favorable prior year reserve development of
$394 million in 2006 primarily resulted from better thanexpected personal auto bodily injury loss
experience and a decline in the frequency of non-catastropherelated losses in the Homeowners and Other
line of business in the Personal Insurance segment, favorable development on 2005 catastrophe losses in
Personal Insurance and continued improvement in liability and property lines of business in the Business
Insurance segment. This favorable development was partially offset by unfavorable prior year reserve
development primarily related to increases in reserves for asbestos, environmental and certain assumed
reinsurance business, all in the Business Insurance segment. Net unfavorable prior year reserve
developmentin2005 of $325 million was driven by a charge to strengthen asbestos reserves, which was
partially offset by other non-asbestos related net favorable prior year reserve development in all three
business segments.
Income from continuing operations in 2005 totaled $2.06 billion, or $2.95 per share diluted, compared
with income from continuing operations of $867 million, or$1.40 per share diluted, in2004. The increase
in income in 2005 reflected the impact of the merger, improved non-catastrophe related current year loss
experience in the Company’s three reportable business segments, a decline in net unfavorable prior year
reserve development and strong growth in net investment income. These factors more than offset a
significant increase in the cost of catastrophes, which totaled $2.19 billion in 2005, compared with
$772 million in 2004. The catastrophe losses in 2004 were primarily the result of four hurricanes that struck
the southeastern United States in the third quarter. Net unfavorable prior year reserve development in
2005 totaled $325 million, compared with net unfavorable prior year reserve development of $2.39 billion
in 2004.The netunfavorable prior year reserve development in 2004 was concentrated in the Business
Insurance and Financial, Professional & International Insurance segments. Net unfavorable reserve
developmentin theBusiness Insurance and Financial, Professional & International Insurance segments in
2004 more than offset additional income resulting from the merger and strong operating income generated
by the Company’s Personal Insurance segment.
In 2005, the Company sold its equity interest in NuveenInvestments, which constituted its Asset
Management segment. The Company recorded a net loss from discontinued operations of $439 million,
consisting primarily of $710 million of tax expense which resulted from the difference between the tax basis
and the GAAP carrying value of the Company’s investment in Nuveen Investments, partially offset by the
$224 million after-tax gain on the divestiture and the Company’s share of Nuveen Investments’ net income
for 2005. Income from discontinued operations of $88 million in 2004 represented the Company’s share of
Nuveen Investments’ net income for the year.
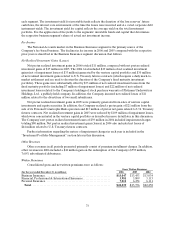
Revenues
Earned Premiums
Earned premiums in 2006totaled $20.76 billion, an increase of$419 million, or 2%, over the 2005
total of $20.34 billion. Earned premiums in 2006 were negatively impacted by an increase in property
catastrophe reinsurance costs. Earnedpremiums in 2005 were reduced by $121 million of reinstatement
premiums, which represent additional premiums payable to reinsurers to maintain coverage limits for
certain excess-of-loss reinsurance treaties. In the Personal Insurance segment, earned premium growth of
9% in 2006 reflected strongnew business volume and continued renewal price increases. In the Business
Insurance segment, earned premiums in 2006 declined 2% from the comparable 2005 total, primarily
reflecting theimpact of business in runoff and the sale of the Personal Catastrophe Risk operation in
November 2005. Earned premiums in the Financial, Professional & International Insurance segment in