Travelers 2006 Annual Report Download - page 121
Download and view the complete annual report
Please find page 121 of the 2006 Travelers annual report below. You can navigate through the pages in the report by either clicking on the pages listed below, or by using the keyword search tool below to find specific information within the annual report.-
 1
1 -
2
-
3
-
4
-
5
-
6
-
7
-
8
-
9
-
10
-
11
-
12
-
13
-
14
-
15
-
16
-
17
-
18
-
19
-
20
-
21
-
22
-
23
-
24
-
25
-
26
-
27
-
28
-
29
-
30
-
31
-
32
-
33
-
34
-
35
-
36
-
37
-
38
-
39
-
40
-
41
-
42
-
43
-
44
-
45
-
46
-
47
-
48
-
49
-
50
-
51
-
52
-
53
-
54
-
55
-
56
-
57
-
58
-
59
-
60
-
61
-
62
-
63
-
64
-
65
-
66
-
67
-
68
-
69
-
70
-
71
-
72
-
73
-
74
-
75
-
76
-
77
-
78
-
79
-
80
-
81
-
82
-
83
-
84
-
85
-
86
-
87
-
88
-
89
-
90
-
91
-
92
-
93
-
94
-
95
-
96
-
97
-
98
-
99
-
100
-
101
-
102
-
103
-
104
-
105
-
106
-
107
-
108
-
109
-
110
-
 111
111 -
 112
112 -
 113
113 -
 114
114 -
 115
115 -
 116
116 -
 117
117 -
 118
118 -
 119
119 -
 120
120 -
 121
121 -
 122
122 -
 123
123 -
 124
124 -
 125
125 -
 126
126 -
 127
127 -
 128
128 -
 129
129 -
 130
130 -
 131
131 -
132
-
133
-
134
-
135
-
136
-
137
-
138
-
139
-
140
-
141
-
142
-
143
-
144
-
145
-
146
-
147
-
148
-
149
-
150
-
151
-
152
-
153
-
154
-
155
-
156
-
157
-
158
-
159
-
160
-
161
-
162
-
163
-
164
-
165
-
166
-
167
-
168
-
169
-
170
-
171
-
172
-
173
-
174
-
175
-
176
-
177
-
178
-
179
-
180
-
181
-
182
-
183
-
184
-
185
-
186
-
187
-
188
-
189
-
190
-
191
-
192
-
193
-
194
-
195
-
196
-
197
-
198
-
199
-
200
-
201
-
202
-
203
-
204
-
205
-
206
-
207
-
208
-
209
-
210
-
211
-
212
-
213
-
214
-
215
-
216
-
217
-
218
-
219
-
220
-
221
-
222
-
223
-
224
-
225
-
226
-
227
-
228
-
229
-
230
-
231
-
232
-
233
-
234
-
235
-
236
-
237
-
238
-
239
-
240
-
241
-
242
-
243
-
244
-
245
-
246
-
247
-
248
-
249
-
250
-
251
-
252
-
253
-
254
-
255
-
256
-
257
-
258
-
259
-
260
-
261
-
262
-
263
-
264
-
265
-
266
-
267
-
268
-
269
-
270
-
271
-
272
-
273
-
274
-
275
-
276
-
277
-
278
-
279
-
280
-
281
-
282
-
283
-
284
-
285
 |
 |
109
interest payments produced by the Company’s fixed income portfolio adequately fund the estimated runoff
of the Company’s insurance reserves. Although this is not an exact cash flow match in each period, the
substantial degree by which the market value of the fixed income portfolio exceeds the present value of the
net insurance liabilities, plus the positive cash flow from newly sold policies and the large amount of high
quality liquid bonds provides assurance of the Company’s ability to fund the payment of claims without
having to sell illiquid assets or access credit facilities.
Sale ofSubsidiary. The Company’s cash flows in 2005 included $2.40 billion of pretax proceeds(after
underwriting fees and transaction costs) from the divestiture of its equity interest in Nuveen Investments.
Of this amount, $405 million was receiveddirectly by the Company’s insurance subsidiaries, and the
remainder was received directly by the holding company. Of the proceeds received directly by the holding
company, $1.225 billion was contributed to the capital of the Company’s insurance subsidiaries, with the
remainder available for general corporate purposes. Holding company liquidity levels were increased in
2005 through dividends received from the Company’s operating subsidiaries, the retained proceeds from
the Nuveen Investments divestiture, the proceeds of $442 million from the issuance of common stock
(described below) and the issuance of $400 million of 5.50% senior notes.
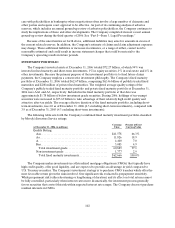
At December 31, 2006, total cash, short-term invested assets and other readily marketable securities
aggregating $1.45 billion were held at the holding company level. The assets held at the holding company,
combined with other sources of funds available, primarilyadditional dividends from operating subsidiaries,
are considered sufficient to meet the liquidity requirements of the Company. These liquidity requirements
primarily include shareholder dividends and debt service.
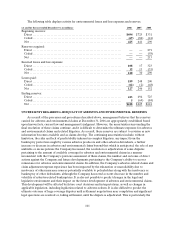
Financing Activities
Net cash flows used in financing activities of continuing operations totaled $1.59 billion, $473 million
and $516 million in 2006, 2005 and 2004, respectively. The 2006 total primarily reflected common share
repurchases and dividends to shareholders, partially offset by proceeds from employee stock option
exercises. In 2005, the total primarily reflected the repayment of debt and dividends to shareholders, which
were partially offset by the issuance of common stock pursuant to the maturity of equity unit forward
contracts and the issuance of debt. Dividends paid to shareholders were the primary factor in cash used in
financing activities in 2004.
Debt Transactions. In June 2006, the Company issued $400 million aggregate principal amount of
6.25% senior unsecured notes due June 20, 2016 and $400 million aggregate principal amount of 6.75%
senior unsecured notes due June 20, 2036. The notes were issued at a discount, resulting in effective
interest rates of 6.30% and 6.86%, respectively. Net proceeds from the issuances (after original issue
discount and expenses) totaled approximately $786 million, which the Company applied to the redemption
of approximately $593 million of 7.60% subordinated debentures (described in more detail below), $150
million of 6.75% senior notes that matured on November 15, 2006 and $56 million of medium-term notes
that matured in the second half of the year.
In November 2006, the Company redeemed $593 million of 7.60% subordinated debentures originally
issued in 2001 and due October 15, 2050. The debentures were redeemable by the Company on or after
November 13, 2006. In November 2001, St. Paul Capital Trust I, a business trust, issued $575 million of
preferred securities, theproceeds of which, along with $18 million in capital provided by the Company,
were used to purchase the subordinated debentures issued by the Company. Upon the Company’s
redemption of its subordinated debentures in November 2006, St. Paul Capital Trust I in turn used the
proceeds to redeem its preferred securities. St. Paul Capital Trust I was then liquidated, and the Company
received an $18 million distribution of capital. The Company recorded a $42 million pretax gain on the
redemption of the subordinated debentures, representing the remaining unamortized fair value adjustment