Travelers 2006 Annual Report Download - page 82
Download and view the complete annual report
Please find page 82 of the 2006 Travelers annual report below. You can navigate through the pages in the report by either clicking on the pages listed below, or by using the keyword search tool below to find specific information within the annual report.-
 1
1 -
2
-
3
-
4
-
5
-
6
-
7
-
8
-
9
-
10
-
11
-
12
-
13
-
14
-
15
-
16
-
17
-
18
-
19
-
20
-
21
-
22
-
23
-
24
-
25
-
26
-
27
-
28
-
29
-
30
-
31
-
32
-
33
-
34
-
35
-
36
-
37
-
38
-
39
-
40
-
41
-
42
-
43
-
44
-
45
-
46
-
47
-
48
-
49
-
50
-
51
-
52
-
53
-
54
-
55
-
56
-
57
-
58
-
59
-
60
-
61
-
62
-
63
-
64
-
65
-
66
-
67
-
68
-
69
-
70
-
71
-
 72
72 -
 73
73 -
 74
74 -
 75
75 -
 76
76 -
 77
77 -
 78
78 -
 79
79 -
 80
80 -
 81
81 -
 82
82 -
 83
83 -
 84
84 -
 85
85 -
 86
86 -
 87
87 -
 88
88 -
 89
89 -
 90
90 -
 91
91 -
 92
92 -
93
-
94
-
95
-
96
-
97
-
98
-
99
-
100
-
101
-
102
-
103
-
104
-
105
-
106
-
107
-
108
-
109
-
110
-
111
-
112
-
113
-
114
-
115
-
116
-
117
-
118
-
119
-
120
-
121
-
122
-
123
-
124
-
125
-
126
-
127
-
128
-
129
-
130
-
131
-
132
-
133
-
134
-
135
-
136
-
137
-
138
-
139
-
140
-
141
-
142
-
143
-
144
-
145
-
146
-
147
-
148
-
149
-
150
-
151
-
152
-
153
-
154
-
155
-
156
-
157
-
158
-
159
-
160
-
161
-
162
-
163
-
164
-
165
-
166
-
167
-
168
-
169
-
170
-
171
-
172
-
173
-
174
-
175
-
176
-
177
-
178
-
179
-
180
-
181
-
182
-
183
-
184
-
185
-
186
-
187
-
188
-
189
-
190
-
191
-
192
-
193
-
194
-
195
-
196
-
197
-
198
-
199
-
200
-
201
-
202
-
203
-
204
-
205
-
206
-
207
-
208
-
209
-
210
-
211
-
212
-
213
-
214
-
215
-
216
-
217
-
218
-
219
-
220
-
221
-
222
-
223
-
224
-
225
-
226
-
227
-
228
-
229
-
230
-
231
-
232
-
233
-
234
-
235
-
236
-
237
-
238
-
239
-
240
-
241
-
242
-
243
-
244
-
245
-
246
-
247
-
248
-
249
-
250
-
251
-
252
-
253
-
254
-
255
-
256
-
257
-
258
-
259
-
260
-
261
-
262
-
263
-
264
-
265
-
266
-
267
-
268
-
269
-
270
-
271
-
272
-
273
-
274
-
275
-
276
-
277
-
278
-
279
-
280
-
281
-
282
-
283
-
284
-
285
 |
 |

70
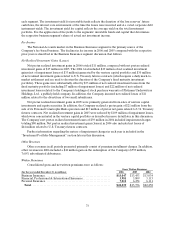
Consolidated Results of Operations
For the year ended December 31, 2006 2005 2004
Revenues
Premiums...................................................... $20,760 $ 2 0,341 $19,038
Net investment inco me .......................................... 3,517 3,165 2,663
Fee income .................................................... 591 664 706
Net realized investment gains (losses) ............................. 11 17 (39)
Other revenues ................................................. 211 178 176
Total revenues 25,090 24,365 22,544
Claims and expenses
Claims and claim adjustment expenses. ............................ 12,244 14,927 15,439
Amortizationof deferred acquisition costs ......................... 3,339 3,252 2,978
General and administrative expenses .............................. 3,458 3,229 2,945
Interest expense ................................................ 324 286 236
Total claims and expenses ................................. 19,365 21,694 21,598
Income from continuingoperations before income taxes and
minority interest ......................................... 5,725 2,671 946
Income tax expense ............................................. 1,517 610 69
Minority interest, net of tax ......................................—— 10
Income from continuing operations ........................... 4,208 2,061 867
Discontinued operations:
Operating income (loss), net of taxes ............................—(663) 88
Gain on disposal, net of taxes..................................—224 —
Income (loss) fromdiscontinuedoperations....................—(439) 88
Net income ................................................ $4,208 $1,622 $ 955
Incomefrom continuing operations pershare
Basic...................................................... $ 6.12 $3.04 $ 1.42
Diluted(1)................................................. $ 5.91 $2.95 $ 1.40
GAAP combined ratio
Loss and loss adjustment expense rati o........................ 57.5% 71.9 % 79.4%
Underwriting expense ratio.................................. 30.6 29.4 28.3
GAAP combined ratio ..................................... 88.1% 101.3 % 107.7%
(1) The weighted average number of common shares used in the diluted earnings per share calculation
for the year ended December 31, 2004 excluded the potentially dilutive effect of the Company’s
convertible junior subordinated notes because their effect was anti-dilutive.
The Company’s discussions related to all items, other than net income, income from continuing
operations, income (loss) from discontinued operations, and segment operating income (loss), are
presented on a pretax basis, unless otherwise noted. Throughout the following discussion, the Company
references the “impact of the merger” in the context of a comparison between 2005 and 2004, referring to
the fact that the Company’s 2005 results reflected a full year of combined post-merger operations, whereas
the Company’s 2004 results reflected combinedpost-merger operations for the nine months subsequent to
the April 1, 2004 mergerdate, plus the results of TPC only for the three months ended March 31, 2004.
Overview
Income from continuing operations in 2006 totaled $4.21 billion, or $5.91 per share diluted, compared
with 2005 income from continuing operations of $2.06 billion, or $2.95 per share diluted. The $2.15 billion
increase in 2006 operating results reflected a significant decline in catastrophe losses, net favorable prior