Travelers 2006 Annual Report Download - page 87
Download and view the complete annual report
Please find page 87 of the 2006 Travelers annual report below. You can navigate through the pages in the report by either clicking on the pages listed below, or by using the keyword search tool below to find specific information within the annual report.-
 1
1 -
2
-
3
-
4
-
5
-
6
-
7
-
8
-
9
-
10
-
11
-
12
-
13
-
14
-
15
-
16
-
17
-
18
-
19
-
20
-
21
-
22
-
23
-
24
-
25
-
26
-
27
-
28
-
29
-
30
-
31
-
32
-
33
-
34
-
35
-
36
-
37
-
38
-
39
-
40
-
41
-
42
-
43
-
44
-
45
-
46
-
47
-
48
-
49
-
50
-
51
-
52
-
53
-
54
-
55
-
56
-
57
-
58
-
59
-
60
-
61
-
62
-
63
-
64
-
65
-
66
-
67
-
68
-
69
-
70
-
71
-
72
-
73
-
74
-
75
-
76
-
 77
77 -
 78
78 -
 79
79 -
 80
80 -
 81
81 -
 82
82 -
 83
83 -
 84
84 -
 85
85 -
 86
86 -
 87
87 -
 88
88 -
 89
89 -
 90
90 -
 91
91 -
 92
92 -
 93
93 -
 94
94 -
 95
95 -
 96
96 -
 97
97 -
98
-
99
-
100
-
101
-
102
-
103
-
104
-
105
-
106
-
107
-
108
-
109
-
110
-
111
-
112
-
113
-
114
-
115
-
116
-
117
-
118
-
119
-
120
-
121
-
122
-
123
-
124
-
125
-
126
-
127
-
128
-
129
-
130
-
131
-
132
-
133
-
134
-
135
-
136
-
137
-
138
-
139
-
140
-
141
-
142
-
143
-
144
-
145
-
146
-
147
-
148
-
149
-
150
-
151
-
152
-
153
-
154
-
155
-
156
-
157
-
158
-
159
-
160
-
161
-
162
-
163
-
164
-
165
-
166
-
167
-
168
-
169
-
170
-
171
-
172
-
173
-
174
-
175
-
176
-
177
-
178
-
179
-
180
-
181
-
182
-
183
-
184
-
185
-
186
-
187
-
188
-
189
-
190
-
191
-
192
-
193
-
194
-
195
-
196
-
197
-
198
-
199
-
200
-
201
-
202
-
203
-
204
-
205
-
206
-
207
-
208
-
209
-
210
-
211
-
212
-
213
-
214
-
215
-
216
-
217
-
218
-
219
-
220
-
221
-
222
-
223
-
224
-
225
-
226
-
227
-
228
-
229
-
230
-
231
-
232
-
233
-
234
-
235
-
236
-
237
-
238
-
239
-
240
-
241
-
242
-
243
-
244
-
245
-
246
-
247
-
248
-
249
-
250
-
251
-
252
-
253
-
254
-
255
-
256
-
257
-
258
-
259
-
260
-
261
-
262
-
263
-
264
-
265
-
266
-
267
-
268
-
269
-
270
-
271
-
272
-
273
-
274
-
275
-
276
-
277
-
278
-
279
-
280
-
281
-
282
-
283
-
284
-
285
 |
 |
75
contracts. This adjustment affected only the statistical disclosure of net written premiums on a quarter-
by-quarter basis; it did not affect net written premium amounts over the lives of the respective agreements,
nor did it impact gross written premiums, earned premiums, operating results or capital. The adjustment
was made to conform the statistical measurement of production—net written premiums—across the
Company’s businesses.
Claims and expenses
Claims and Claim Adjustment Expenses
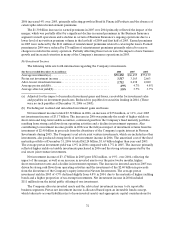
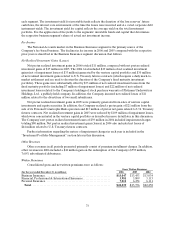
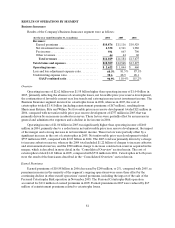
Claims and claim adjustment expenses totaled $12.24 billion in 2006, $2.68 billion less than the 2005
total of $14.93 billion. The 2006 total included $103 million of catastrophe losses and $394 million of net
favorable prior year reserve development, whereas the2005 total included $2.03 billion of catastrophe
losses and $325 million of net unfavorable prior year reserve development. Catastrophe losses in 2005
primarily resulted from Hurricanes Katrina, Rita and Wilma. Net favorable prior year reserve
developmentin2006 was concentrated in the Personal Insurance segment, primarily reflecting better than
expected loss experience in the auto bodily injury andnon-catastrophe related Homeowners and Other
lines of business, and a reduction in loss estimates for the 2005 hurricanes. The Business Insurance
segment also experienced net favorable prior year loss experience in its ongoing operations in 2006,
primarily in the commercial multi-peril, general liability, property and commercial automobile lines of
business. That favorable development was partially offset by increases to asbestos and environmental
reserves, which are discussed in moredetailin the “Asbestos Claims and Litigation” and “Environmental
Claims and Litigation” sections herein. There was also unfavorable prior year reserve development in
runoff assumed reinsurance business. In 2005, the net unfavorable prior year reserve development was
concentrated in the Business Insurance segment and was primarily driven by an increase to asbestos
reserves, which was partially offset by other, non-asbestos related net favorable prior year reserve
development in all three business segments.
Claims and claim adjustment expenses of $14.93 billion in 2005 were $512 million lower than the 2004
total of $15.44 billion. The 2005 total included $2.03 billion of catastrophe losses, compared with $761
million of such losses in 2004. The cost of catastrophes is discussed in more detail in the following
narrative. The 2005 total also included $325 million of net unfavorable prior year reserve development, as
described above, compared with $2.39 billion of net unfavorable prior year reservedevelopment in 2004.
Claims and claim adjustment expenses in 2005 also reflected improvement in current accidentyear
non-catastrophe related loss experience as compared with 2004.
The 2004 net unfavorable prior year reserve development of $2.39 billion included a $928 million
charge to increase asbestos reserves and a $290 million charge to increase environmental reserves.
In addition, the 2004 total included charges to increase the acquired net construction and surety
reserves by $500 million and $300 million, respectively, and a charge of $252 million related to the financial
condition of a specific construction contractor. The following discussion provides more information
regarding the net unfavorable prior year loss development related to these three items in 2004, aswell as
other reserving actions.
Upon having access to each company’s detailed policyholder information, including underwriting,
claim, and actuarial files onApril 1, 2004, in connection with the closing of the merger, the Company was
able to begin the detailed process of developing a uniform and consistentapproach to estimating the
combined company’s loss reserves. As part of that process, a team ofactuaries representing the historical
actuarial perspectives, judgments and methods applied by each legacy company, discussed their views,
methodologies, and analysisof available data.
In addition to the discussion in the Critical Accounting Estimates section of this report, other items
specifically considered in the process of developing a uniform and consistent approach to estimating the
combined company’s loss reserves after the merger included interpreting the actuarial and claim data in a