Travelers 2006 Annual Report Download - page 271
Download and view the complete annual report
Please find page 271 of the 2006 Travelers annual report below. You can navigate through the pages in the report by either clicking on the pages listed below, or by using the keyword search tool below to find specific information within the annual report.-
 1
1 -
2
-
3
-
4
-
5
-
6
-
7
-
8
-
9
-
10
-
11
-
12
-
13
-
14
-
15
-
16
-
17
-
18
-
19
-
20
-
21
-
22
-
23
-
24
-
25
-
26
-
27
-
28
-
29
-
30
-
31
-
32
-
33
-
34
-
35
-
36
-
37
-
38
-
39
-
40
-
41
-
42
-
43
-
44
-
45
-
46
-
47
-
48
-
49
-
50
-
51
-
52
-
53
-
54
-
55
-
56
-
57
-
58
-
59
-
60
-
61
-
62
-
63
-
64
-
65
-
66
-
67
-
68
-
69
-
70
-
71
-
72
-
73
-
74
-
75
-
76
-
77
-
78
-
79
-
80
-
81
-
82
-
83
-
84
-
85
-
86
-
87
-
88
-
89
-
90
-
91
-
92
-
93
-
94
-
95
-
96
-
97
-
98
-
99
-
100
-
101
-
102
-
103
-
104
-
105
-
106
-
107
-
108
-
109
-
110
-
111
-
112
-
113
-
114
-
115
-
116
-
117
-
118
-
119
-
120
-
121
-
122
-
123
-
124
-
125
-
126
-
127
-
128
-
129
-
130
-
131
-
132
-
133
-
134
-
135
-
136
-
137
-
138
-
139
-
140
-
141
-
142
-
143
-
144
-
145
-
146
-
147
-
148
-
149
-
150
-
151
-
152
-
153
-
154
-
155
-
156
-
157
-
158
-
159
-
160
-
161
-
162
-
163
-
164
-
165
-
166
-
167
-
168
-
169
-
170
-
171
-
172
-
173
-
174
-
175
-
176
-
177
-
178
-
179
-
180
-
181
-
182
-
183
-
184
-
185
-
186
-
187
-
188
-
189
-
190
-
191
-
192
-
193
-
194
-
195
-
196
-
197
-
198
-
199
-
200
-
201
-
202
-
203
-
204
-
205
-
206
-
207
-
208
-
209
-
210
-
211
-
212
-
213
-
214
-
215
-
216
-
217
-
218
-
219
-
220
-
221
-
222
-
223
-
224
-
225
-
226
-
227
-
228
-
229
-
230
-
231
-
232
-
233
-
234
-
235
-
236
-
237
-
238
-
239
-
240
-
241
-
242
-
243
-
244
-
245
-
246
-
247
-
248
-
249
-
250
-
251
-
252
-
253
-
254
-
255
-
256
-
257
-
258
-
259
-
260
-
 261
261 -
 262
262 -
 263
263 -
 264
264 -
 265
265 -
 266
266 -
 267
267 -
 268
268 -
 269
269 -
 270
270 -
 271
271 -
 272
272 -
 273
273 -
 274
274 -
 275
275 -
 276
276 -
 277
277 -
 278
278 -
 279
279 -
 280
280 -
 281
281 -
282
-
283
-
284
-
285
 |
 |

259
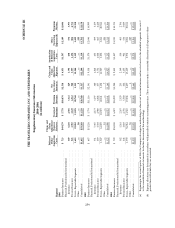
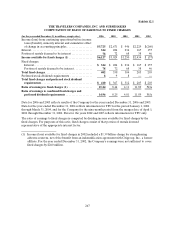
SCHEDULE III
THE TRAVELERS COMPANIES, INC. AND SUBSIDIARIES
Supplementary Insurance Information
2004-2006
(in millions)
Segment
Deferred
Policy
Acquisition
Costs
Claims and
Claim
Adjustment
Expense
Reserves
Unearned
Premiums
Premium
Revenue
Net
Investment
Income(a)
Claims and
Claim
Adjustment
Expenses
Amortization
of Deferred
Acquisition
Costs
Other
Operating
Expenses(b)
Premiums
Written
2006
Business Insurance ...................... $ 723$ 4 9,179 $5,778 $ 10,876 $ 2,538$ 6,853 $ 1,547 $ 2,109 $11,046
Financial, Professional & International
Insurance............................ 3696,238 2,3013,321 4291,794 638536 3,393
Personal Insurance...................... 5233,785 3,1496,563 5483,5971,154 804 6,711
Total—Reportable Segments.............. 1,61559,202 11,228 20,760 3,51512,2443,339 3,449 21,150
Other................................. — 86 —— 2 ——333 —
Consolidated........................... $ 1,615$ 5 9,288 $ 11,228 $ 20,760 $ 3,517$ 1 2,244$ 3 ,339 $ 3,782 $21,150
2005
Business Insurance ...................... $ 687 $ 51,238 $5,774 $ 1 1,116 $ 2,341 $ 9,358$ 1,570 $ 2,040 $10,999
Financial, Professional & International
Insurance............................ 351 5,465 2,173 3,197 360 1,818634 509 3,159
Personal Insurance...................... 489 4,304 2,980 6,028 457 3,7511,048 665 6,228
Total—Reportable Segments .............. 1,527 61,007 10,927 20,341 3,158 14,9273,252 3,214 20,386
Other.................................— 83 —— 7 — — 301 —
Consolidated ........................... $ 1,527 $ 61,090 $ 1 0,927 $ 2 0,341 $ 3,165 $ 14,927$ 3 ,252 $ 3,515 $20,386
2004
Business Insurance ...................... $ 729 $ 50,120 $6,287 $ 1 0,929 $ 1,980 $ 9,835$ 1,507 $ 1,955 $10,374
Financial, Professional & International
Insurance............................ 382 5,261 2,267 2,529 235 2,349530 405 2,708
Personal Insurance...................... 4 48 3,603 2,756 5,580 442 3,255941 536 5,929
Total—Reportable Segments .............. 1,559 58, 984 11,310 19,038 2,657 15,4392,978 2,896 19,011
Other................................. — 86 —— 6 — — 285 —
Consolidated ........................... $ 1,559 $ 59,070 $ 1 1,310 $ 1 9,038 $ 2,663 $ 15,439$ 2,978 $ 3,181 $19,011
(a)Beginning in the second quarter of 2004, the Company developed a methodology to allocate net investment income and invested assets to the identified segments. See note 2
to the consolidated financial statements for further discussionofthis methodology.
(b) Expense allocations are determined in accordance with prescribed statutory accounting practices. These practices make a reasonable allocation of all expenses to those
product lines with which they are associated.