Travelers 2006 Annual Report Download - page 92
Download and view the complete annual report
Please find page 92 of the 2006 Travelers annual report below. You can navigate through the pages in the report by either clicking on the pages listed below, or by using the keyword search tool below to find specific information within the annual report.-
 1
1 -
2
-
3
-
4
-
5
-
6
-
7
-
8
-
9
-
10
-
11
-
12
-
13
-
14
-
15
-
16
-
17
-
18
-
19
-
20
-
21
-
22
-
23
-
24
-
25
-
26
-
27
-
28
-
29
-
30
-
31
-
32
-
33
-
34
-
35
-
36
-
37
-
38
-
39
-
40
-
41
-
42
-
43
-
44
-
45
-
46
-
47
-
48
-
49
-
50
-
51
-
52
-
53
-
54
-
55
-
56
-
57
-
58
-
59
-
60
-
61
-
62
-
63
-
64
-
65
-
66
-
67
-
68
-
69
-
70
-
71
-
72
-
73
-
74
-
75
-
76
-
77
-
78
-
79
-
80
-
81
-
 82
82 -
 83
83 -
 84
84 -
 85
85 -
 86
86 -
 87
87 -
 88
88 -
 89
89 -
 90
90 -
 91
91 -
 92
92 -
 93
93 -
 94
94 -
 95
95 -
 96
96 -
 97
97 -
 98
98 -
 99
99 -
 100
100 -
 101
101 -
 102
102 -
103
-
104
-
105
-
106
-
107
-
108
-
109
-
110
-
111
-
112
-
113
-
114
-
115
-
116
-
117
-
118
-
119
-
120
-
121
-
122
-
123
-
124
-
125
-
126
-
127
-
128
-
129
-
130
-
131
-
132
-
133
-
134
-
135
-
136
-
137
-
138
-
139
-
140
-
141
-
142
-
143
-
144
-
145
-
146
-
147
-
148
-
149
-
150
-
151
-
152
-
153
-
154
-
155
-
156
-
157
-
158
-
159
-
160
-
161
-
162
-
163
-
164
-
165
-
166
-
167
-
168
-
169
-
170
-
171
-
172
-
173
-
174
-
175
-
176
-
177
-
178
-
179
-
180
-
181
-
182
-
183
-
184
-
185
-
186
-
187
-
188
-
189
-
190
-
191
-
192
-
193
-
194
-
195
-
196
-
197
-
198
-
199
-
200
-
201
-
202
-
203
-
204
-
205
-
206
-
207
-
208
-
209
-
210
-
211
-
212
-
213
-
214
-
215
-
216
-
217
-
218
-
219
-
220
-
221
-
222
-
223
-
224
-
225
-
226
-
227
-
228
-
229
-
230
-
231
-
232
-
233
-
234
-
235
-
236
-
237
-
238
-
239
-
240
-
241
-
242
-
243
-
244
-
245
-
246
-
247
-
248
-
249
-
250
-
251
-
252
-
253
-
254
-
255
-
256
-
257
-
258
-
259
-
260
-
261
-
262
-
263
-
264
-
265
-
266
-
267
-
268
-
269
-
270
-
271
-
272
-
273
-
274
-
275
-
276
-
277
-
278
-
279
-
280
-
281
-
282
-
283
-
284
-
285
 |
 |
80
also reflected an improvement in current accident year non-catastrophe related loss experience, compared
with 2004, primarily reflecting reduced claim activity. The 1.1 point increase in the 2005 underwriting
expense ratio compared with 2004 reflected the impact of reinstatement premiums, state assessments,
increased commission expenses in the Personal Insurance segment and investments made for process re-
engineering and to support business growth andproduct development, primarily in the Personal Insurance
segment. These factors were partially offset by expense efficiencies realized since the completion of the
merger.
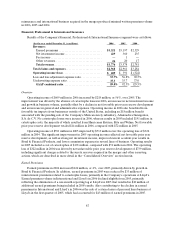
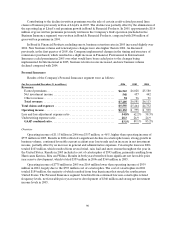
Discontinued Operations
In March 2005, the Company and Nuveen Investments jointly announced that the Company would
implement a program to divest its 78% equity interest in Nuveen Investments, which constituted the
Company’s Asset Management segment and was acquired as partof the merger on April 1, 2004. The
divestiture was completed through a series of transactions in the second and third quarters of 2005,
resulting in net pretax cashproceeds of $2.40 billion.
The Company recorded a net operating loss from discontinued operations of $663 million in 2005,
consisting primarily of $710 million of tax expense due to thedifference between the tax basis and the
GAAP carrying value of the Company’s investment in Nuveen Investments, partially offset by the
Company’s share of NuveenInvestments’ net income prior to divestiture. The Company recorded a pretax
gain ondisposal of $345 million ($224 million after-tax) in 2005. Income from discontinued operations of
$88 million in 2004 represented the Company’s share of NuveenInvestments’ net income for the year.