The Hartford 2009 Annual Report Download - page 99
Download and view the complete annual report
Please find page 99 of the 2009 The Hartford annual report below. You can navigate through the pages in the report by either clicking on the pages listed below, or by using the keyword search tool below to find specific information within the annual report.-
 1
1 -
2
-
3
-
4
-
5
-
6
-
7
-
8
-
9
-
10
-
11
-
12
-
13
-
14
-
15
-
16
-
17
-
18
-
19
-
20
-
21
-
22
-
23
-
24
-
25
-
26
-
27
-
28
-
29
-
30
-
31
-
32
-
33
-
34
-
35
-
36
-
37
-
38
-
39
-
40
-
41
-
42
-
43
-
44
-
45
-
46
-
47
-
48
-
49
-
50
-
51
-
52
-
53
-
54
-
55
-
56
-
57
-
58
-
59
-
60
-
61
-
62
-
63
-
64
-
65
-
66
-
67
-
68
-
69
-
70
-
71
-
72
-
73
-
74
-
75
-
76
-
77
-
78
-
79
-
80
-
81
-
82
-
83
-
84
-
85
-
86
-
87
-
88
-
 89
89 -
 90
90 -
 91
91 -
 92
92 -
 93
93 -
 94
94 -
 95
95 -
 96
96 -
 97
97 -
 98
98 -
 99
99 -
 100
100 -
 101
101 -
 102
102 -
 103
103 -
 104
104 -
 105
105 -
 106
106 -
 107
107 -
 108
108 -
 109
109 -
110
-
111
-
112
-
113
-
114
-
115
-
116
-
117
-
118
-
119
-
120
-
121
-
122
-
123
-
124
-
125
-
126
-
127
-
128
-
129
-
130
-
131
-
132
-
133
-
134
-
135
-
136
-
137
-
138
-
139
-
140
-
141
-
142
-
143
-
144
-
145
-
146
-
147
-
148
-
149
-
150
-
151
-
152
-
153
-
154
-
155
-
156
-
157
-
158
-
159
-
160
-
161
-
162
-
163
-
164
-
165
-
166
-
167
-
168
-
169
-
170
-
171
-
172
-
173
-
174
-
175
-
176
-
177
-
178
-
179
-
180
-
181
-
182
-
183
-
184
-
185
-
186
-
187
-
188
-
189
-
190
-
191
-
192
-
193
-
194
-
195
-
196
-
197
-
198
-
199
-
200
-
201
-
202
-
203
-
204
-
205
-
206
-
207
-
208
-
209
-
210
-
211
-
212
-
213
-
214
-
215
-
216
-
217
-
218
-
219
-
220
-
221
-
222
-
223
-
224
-
225
-
226
-
227
-
228
-
229
-
230
-
231
-
232
-
233
-
234
-
235
-
236
-
237
-
238
-
239
-
240
-
241
-
242
-
243
-
244
-
245
-
246
-
247
-
248
-
249
-
250
-
251
-
252
-
253
-
254
-
255
-
256
-
257
-
258
-
259
-
260
-
261
-
262
-
263
-
264
-
265
-
266
-
267
 |
 |

99
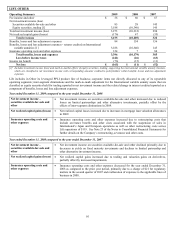
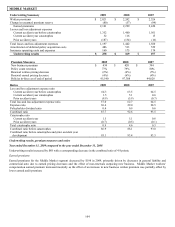
Year ended December 31, 2008 compared to the year ended December 31, 2007
Underwriting results decreased by $42, with a corresponding 1.2 point increase in the combined ratio.
Earned premiums
Earned premiums increased $37, or 1%, due primarily to earned premium growth in AARP, partially offset by earned premium
decreases in Agency and Other.
• AARP earned premium grew $97, reflecting modest renewal earned pricing increases for both auto and homeowners and the effect
of new business premium outpacing non-renewals in the last nine months of 2007. New business offset non-renewals in 2008 and
new business in 2008 was driven by growth in the size of the AARP target market, the effect of direct marketing programs and the
effect of cross-selling homeowners insurance to insureds who have auto policies.
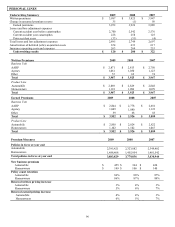
• Agency earned premium decreased by $43 as the effect of a decline in new business premium and policy count retention since the
middle of 2007 was partially offset by the effect of modest renewal earned pricing increases. The market environment continued to
be intensely competitive in 2008. The increase in advertising for auto business among the top carriers also occurred with
homeowners’ business, particularly in non-coastal and non-catastrophe prone areas. In 2008, a number of Personal Lines carriers
began to increase rates although a significant portion of the market continued to compete heavily on price.
• Other earned premium decreased by $17, primarily due to a decision to reduce other affinity business.
Auto earned premium was relatively flat in 2008 as the effect of renewal earned pricing increases of 4% was largely offset by a decrease
in new business since the middle of 2007. Homeowners’ earned premium grew 3% largely due to renewal earned pricing increases of
5%.
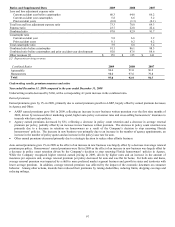
New business
premium
• Both auto and homeowners’ new business written premium decreased in 2008 including decreases in AARP
and Agency. Auto new business decreased by $60, or 14% and homeowners’ new business decreased by
$34, or 24%. AARP new business written premium decreased primarily due to lower auto and
homeowners’ policy conversion rates, driven by increased competition, including the effect of price
decreases by some carriers and the effect of continued advertising among carriers for new business.
Agency new business written premium decreased primarily due to price competition driven, in part, by a
greater number of agents using comparative rating software to obtain quotes from multiple carriers.
Policy count
retention
• Policy count retention for auto decreased, driven primarily by a decrease in policy retention for both AARP
and Agency business. Policy count retention for homeowners decreased for both AARP and Agency
business. The decrease in policy count retention for AARP homeowners’ business was driven by increased
price competition by some carriers. The decrease in policy count retention for Agency homeowners’
business was due, in part, to Florida policyholders non-renewing as a result of the Company’ s decision to
stop renewing Florida homeowners’ policies sold through agents.
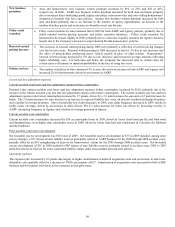
Renewal earned
pricing increase
• Auto renewal earned pricing increases of 4% represent the portion of the 4% increase in renewal written
pricing for 2008 that is reflected in earned premium. In 2008, the Company increased auto insurance rates
in certain states for certain classes to maintain profitability in the face of rising loss costs. Renewal written
pricing increases in 2008 included the effect of policyholders purchasing newer vehicle models in place of
older models. Homeowners’ renewal earned pricing increases of 5% primarily reflected the earning of a
blend of mid-single digit renewal written pricing increases recognized over the last nine months of 2007 and
renewal written pricing increases recognized in the first nine months of 2008. Renewal written pricing
increases in homeowners were largely driven by increases in coverage limits due to rising replacement
costs.
Policies in-force • The number of policies in-force decreased slightly for both auto and homeowners, primarily due to a 7%
decline in the number of Agency policies in-force, partially offset by a 1% increase in the number of AARP
policies in-force.
Losses and loss adjustment expenses
Current accident year losses and loss adjustment expenses before catastrophes
Personal Lines’ current accident year losses and loss adjustment expenses before catastrophes decreased by $34 due to a decrease in the
current accident year loss and loss adjustment expense ratio before catastrophes, partially offset by the effect of higher earned premium.
The current accident year loss and loss adjustment expense ratio before catastrophes decreased by 1.4 points, primarily due to favorable
expected frequency on auto liability claims and the effect of renewal earned pricing increases for both auto and homeowners, partially
offset by increased frequency and severity of non-catastrophe losses on homeowners business.
Current accident year catastrophes
Current accident year catastrophe losses of $258 in 2008 were higher than current accident year catastrophe losses of $125 in 2007,
primarily due to losses from hurricane Ike and tornadoes and thunderstorms in the South and Midwest.