The Hartford 2009 Annual Report Download - page 47
Download and view the complete annual report
Please find page 47 of the 2009 The Hartford annual report below. You can navigate through the pages in the report by either clicking on the pages listed below, or by using the keyword search tool below to find specific information within the annual report.-
 1
1 -
2
-
3
-
4
-
5
-
6
-
7
-
8
-
9
-
10
-
11
-
12
-
13
-
14
-
15
-
16
-
17
-
18
-
19
-
20
-
21
-
22
-
23
-
24
-
25
-
26
-
27
-
28
-
29
-
30
-
31
-
32
-
33
-
34
-
35
-
36
-
 37
37 -
 38
38 -
 39
39 -
 40
40 -
 41
41 -
 42
42 -
 43
43 -
 44
44 -
 45
45 -
 46
46 -
 47
47 -
 48
48 -
 49
49 -
 50
50 -
 51
51 -
 52
52 -
 53
53 -
 54
54 -
 55
55 -
 56
56 -
 57
57 -
58
-
59
-
60
-
61
-
62
-
63
-
64
-
65
-
66
-
67
-
68
-
69
-
70
-
71
-
72
-
73
-
74
-
75
-
76
-
77
-
78
-
79
-
80
-
81
-
82
-
83
-
84
-
85
-
86
-
87
-
88
-
89
-
90
-
91
-
92
-
93
-
94
-
95
-
96
-
97
-
98
-
99
-
100
-
101
-
102
-
103
-
104
-
105
-
106
-
107
-
108
-
109
-
110
-
111
-
112
-
113
-
114
-
115
-
116
-
117
-
118
-
119
-
120
-
121
-
122
-
123
-
124
-
125
-
126
-
127
-
128
-
129
-
130
-
131
-
132
-
133
-
134
-
135
-
136
-
137
-
138
-
139
-
140
-
141
-
142
-
143
-
144
-
145
-
146
-
147
-
148
-
149
-
150
-
151
-
152
-
153
-
154
-
155
-
156
-
157
-
158
-
159
-
160
-
161
-
162
-
163
-
164
-
165
-
166
-
167
-
168
-
169
-
170
-
171
-
172
-
173
-
174
-
175
-
176
-
177
-
178
-
179
-
180
-
181
-
182
-
183
-
184
-
185
-
186
-
187
-
188
-
189
-
190
-
191
-
192
-
193
-
194
-
195
-
196
-
197
-
198
-
199
-
200
-
201
-
202
-
203
-
204
-
205
-
206
-
207
-
208
-
209
-
210
-
211
-
212
-
213
-
214
-
215
-
216
-
217
-
218
-
219
-
220
-
221
-
222
-
223
-
224
-
225
-
226
-
227
-
228
-
229
-
230
-
231
-
232
-
233
-
234
-
235
-
236
-
237
-
238
-
239
-
240
-
241
-
242
-
243
-
244
-
245
-
246
-
247
-
248
-
249
-
250
-
251
-
252
-
253
-
254
-
255
-
256
-
257
-
258
-
259
-
260
-
261
-
262
-
263
-
264
-
265
-
266
-
267
 |
 |

47
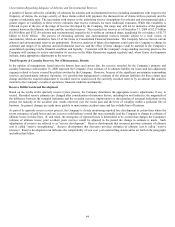
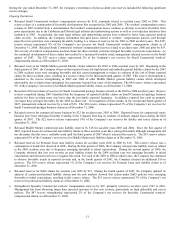
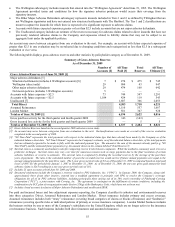
• Strengthened reserves for homeowners’ claims by $18 in 2009, primarily driven by increased claim settlement costs in recent
accident years and increased losses from underground storage tanks in older accident years. In 2008, the Company began to
observe increasing claim settlement costs for the 2005 to 2008 accident years and, in the first quarter of 2009, determined that this
higher cost level would continue, resulting in a reserve strengthening of $9 for these accident years. In addition, beginning in 2008,
the Company observed unfavorable emergence of homeowners' casualty claims for accident years 2003 and prior, primarily related
to underground storage tanks. Following a detailed review of these claims in the first quarter of 2009, management increased its
estimate of the magnitude of this exposure and strengthened homeowners' casualty claim reserves by $9.
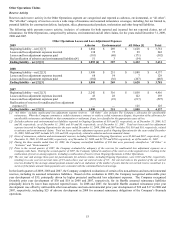
Other Operations
See Other Operations Claims Reserve Activity for information concerning the Company’ s annual evaluation of these reserves and
related reinsurance.
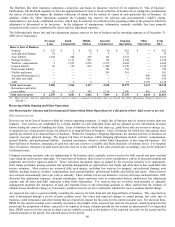
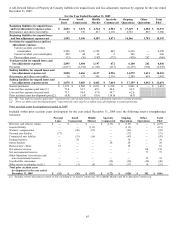
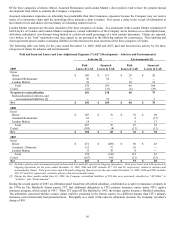
A rollforward of liabilities for unpaid losses and loss adjustment expenses by segment for Property & Casualty for the year ended
December 31, 2008 follows:
For the year ended December 31, 2008
Personal
Lines
Small
Commercial
Middle
Market
Specialty
Commercial
Ongoing
Operations
Other
Operations
Total
P&C
Beginning liabilities for unpaid losses
and loss adjustment expenses-gross
$
2,042
$
3,470
$
4,697
$
6,873 $
17,082
$
5,071
$ 22,153
Reinsurance and other recoverables 81 177 414 2,316 2,988 934 3,922
Beginning liabilities for unpaid losses
and loss adjustment expenses-net
1,961
3,293
4,283
4,557
14,094
4,137
18,231
Provision for unpaid losses and loss
adjustment expenses
Current accident year before
catastrophes
2,542
1,447
1,460
941
6,390
—
6,390
Current accident year catastrophes 258 122 116 47 543 — 543
Prior accident years (51) (89) (134) (81) (355) 129 (226)
Total provision for unpaid losses and
loss adjustment expenses
2,749
1,480
1,442
907
6,578
129
6,707
Payments (2,718) (1,377) (1,418) (593) (6,106) (485) (6,591)
Ending liabilities for unpaid losses and
loss adjustment expenses-net
1,992
3,396
4,307
4,871
14,566
3,781
18,347
Reinsurance and other recoverables 60 176 437 2,110 2,783 803 3,586
Ending liabilities for unpaid losses and
loss adjustment expenses-gross
$
2,052 $
3,572
$
4,744
$
6,981
$
17,349
$
4,584
$ 21,933
Earned premiums $ 3,926 $2,724 $2,299 $1,382 $ 10,331 $ 7 $ 10,338
Loss and loss expense paid ratio [1] 69.2 50.5 61.6 42.8 59.1
Loss and loss expense incurred ratio 70.0 54.3 62.7 65.6 63.7
Prior accident year development (pts.) [2] (1.3) (3.3) (5.9) (5.8) (3.4)
[1] The “loss and loss expense paid ratio” represents the ratio of paid losses and loss adjustment expenses to earned premiums.
[2] “Prior accident year development (pts)” represents the ratio of prior accident year development to earned premiums.
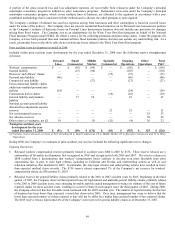
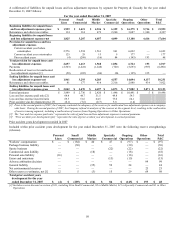
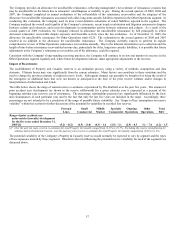
Current accident year catastrophes
For 2008, net current accident year catastrophe loss and loss adjustment expenses totaled $543, of which $237 related to hurricane Ike.
In addition to the $237 of net catastrophe loss and loss adjustment expenses from hurricane Ike, the Company incurred $20 of
assessments due to hurricane Ike. The following table shows total current accident year catastrophe impacts in the year ended December
31, 2008:
For the Year Ended December 31, 2008
Personal
Lines
Small
Commercial
Middle
Market
Specialty
Commercial
Ongoing
Operations
Other
Operations
Total
P&C
Gross incurred claim and claim adjustment
expenses for current accident year
catastrophes
$
260 $
124 $
130 $
58
$
572
$
— $
572
Ceded claim and claim adjustment expenses
for current accident year catastrophes 2 2 14 11 29
— 29
Net incurred claim and claim adjustment
expenses for current accident year
catastrophes
258
122
116
47
543
—
543
Assessments owed to Texas Windstorm
Insurance Association due to hurricane Ike 10 7 3 — 20 — 20
Reinstatement premium ceded to reinsurers
due to hurricane Ike 1 — — — 1 — 1
Total current accident year catastrophe
impacts $ 269 $ 129 $ 119 $ 47 $ 564 $ — $ 564