The Hartford 2009 Annual Report Download - page 166
Download and view the complete annual report
Please find page 166 of the 2009 The Hartford annual report below. You can navigate through the pages in the report by either clicking on the pages listed below, or by using the keyword search tool below to find specific information within the annual report.-
 1
1 -
2
-
3
-
4
-
5
-
6
-
7
-
8
-
9
-
10
-
11
-
12
-
13
-
14
-
15
-
16
-
17
-
18
-
19
-
20
-
21
-
22
-
23
-
24
-
25
-
26
-
27
-
28
-
29
-
30
-
31
-
32
-
33
-
34
-
35
-
36
-
37
-
38
-
39
-
40
-
41
-
42
-
43
-
44
-
45
-
46
-
47
-
48
-
49
-
50
-
51
-
52
-
53
-
54
-
55
-
56
-
57
-
58
-
59
-
60
-
61
-
62
-
63
-
64
-
65
-
66
-
67
-
68
-
69
-
70
-
71
-
72
-
73
-
74
-
75
-
76
-
77
-
78
-
79
-
80
-
81
-
82
-
83
-
84
-
85
-
86
-
87
-
88
-
89
-
90
-
91
-
92
-
93
-
94
-
95
-
96
-
97
-
98
-
99
-
100
-
101
-
102
-
103
-
104
-
105
-
106
-
107
-
108
-
109
-
110
-
111
-
112
-
113
-
114
-
115
-
116
-
117
-
118
-
119
-
120
-
121
-
122
-
123
-
124
-
125
-
126
-
127
-
128
-
129
-
130
-
131
-
132
-
133
-
134
-
135
-
136
-
137
-
138
-
139
-
140
-
141
-
142
-
143
-
144
-
145
-
146
-
147
-
148
-
149
-
150
-
151
-
152
-
153
-
154
-
155
-
 156
156 -
 157
157 -
 158
158 -
 159
159 -
 160
160 -
 161
161 -
 162
162 -
 163
163 -
 164
164 -
 165
165 -
 166
166 -
 167
167 -
 168
168 -
 169
169 -
 170
170 -
 171
171 -
 172
172 -
 173
173 -
 174
174 -
 175
175 -
 176
176 -
177
-
178
-
179
-
180
-
181
-
182
-
183
-
184
-
185
-
186
-
187
-
188
-
189
-
190
-
191
-
192
-
193
-
194
-
195
-
196
-
197
-
198
-
199
-
200
-
201
-
202
-
203
-
204
-
205
-
206
-
207
-
208
-
209
-
210
-
211
-
212
-
213
-
214
-
215
-
216
-
217
-
218
-
219
-
220
-
221
-
222
-
223
-
224
-
225
-
226
-
227
-
228
-
229
-
230
-
231
-
232
-
233
-
234
-
235
-
236
-
237
-
238
-
239
-
240
-
241
-
242
-
243
-
244
-
245
-
246
-
247
-
248
-
249
-
250
-
251
-
252
-
253
-
254
-
255
-
256
-
257
-
258
-
259
-
260
-
261
-
262
-
263
-
264
-
265
-
266
-
267
 |
 |

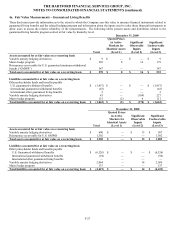
THE HARTFORD FINANCIAL SERVICES GROUP, INC.
NOTES TO CONSOLIDATED FINANCIAL STATEMENTS (continued)
F-17
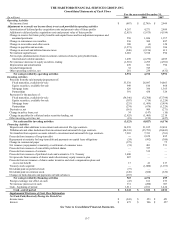
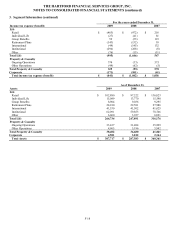
3. Segment Information (continued)
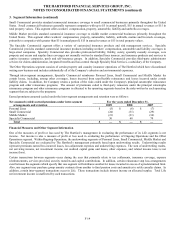
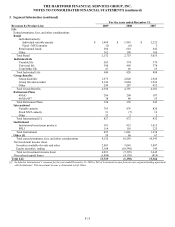
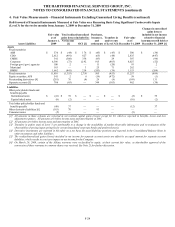
The following table presents net income (loss) for each of Life’ s reporting segments, total Property & Casualty Ongoing Operations,
Property & Casualty Other Operations and Corporate, while underwriting results are presented for the Personal Lines, Small
Commercial, Middle Market and Specialty Commercial segments.
For the years ended December 31,
Net Income (Loss) 2009 2008 2007
Life
Retail $(410) $ (1,399) $ 812
Individual Life 15 (43) 182
Group Benefits 193 (6) 315
Retirement Plans (222) (157) 61
International [1] (183) (325) 223
Institutional [1] (515) (502) 17
Other [1] (165) (11) (52)
Total Life (1,287) (2,443) 1,558
Property & Casualty
Ongoing Operations
Underwriting Results
Personal Lines 120 280 322
Small Commercial 395 437 508
Middle Market 258 169 157
Specialty Commercial 170 71 (18)
Total Ongoing Operations underwriting results 943 957 969
Net servicing income [2] 37 31 52
Net investment income 943 1,056 1,439
Net realized capital losses (266) (1,669) (160)
Other expenses (223) (219) (248)
Income before income taxes 1,434 156 2,052
Income tax expense (benefit) 374 (33) 575
Ongoing Operations 1,060 189 1,477
Other Operations (77) (97) 30
Total Property & Casualty 983 92 1,507
Corporate (583) (398) (116)
Net income (loss) $(887) $ (2,749) $2,949
[1] Included in net income (loss) of International and Institutional is investment income and interest expense, respectively, for the year ended
December 31, 2009 of $68 on an inter-segment funding agreement. This investment income and interest expense is eliminated in Life Other.
[2] Net of expenses related to service business.
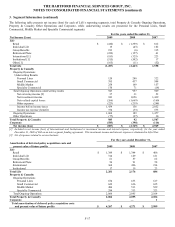
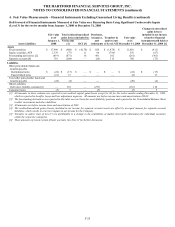
For the years ended December 31,
Amortization of deferred policy acquisition costs and
present value of future profits 2009 2008 2007
Life
Retail $1,389 $1,344 $ 406
Individual Life 314 169 121
Group Benefits 61 57 62
Retirement Plans 56 91 58
International 364 496 214
Institutional 17 19 23
Total Life 2,201 2,176 884
Property & Casualty
Ongoing Operations
Personal Lines 674 633 617
Small Commercial 622 636 635
Middle Market 486 513 529
Specialty Commercial 284 313 323
Total Ongoing Operations 2,066 2,095 2,104
Total Property & Casualty 2,066 2,095 2,104
Corporate — — 1
Total amortization of deferred policy acquisition costs
and present value of future profits $4,267 $4,271 $2,989