The Hartford 2009 Annual Report Download - page 71
Download and view the complete annual report
Please find page 71 of the 2009 The Hartford annual report below. You can navigate through the pages in the report by either clicking on the pages listed below, or by using the keyword search tool below to find specific information within the annual report.-
 1
1 -
2
-
3
-
4
-
5
-
6
-
7
-
8
-
9
-
10
-
11
-
12
-
13
-
14
-
15
-
16
-
17
-
18
-
19
-
20
-
21
-
22
-
23
-
24
-
25
-
26
-
27
-
28
-
29
-
30
-
31
-
32
-
33
-
34
-
35
-
36
-
37
-
38
-
39
-
40
-
41
-
42
-
43
-
44
-
45
-
46
-
47
-
48
-
49
-
50
-
51
-
52
-
53
-
54
-
55
-
56
-
57
-
58
-
59
-
60
-
 61
61 -
 62
62 -
 63
63 -
 64
64 -
 65
65 -
 66
66 -
 67
67 -
 68
68 -
 69
69 -
 70
70 -
 71
71 -
 72
72 -
 73
73 -
 74
74 -
 75
75 -
 76
76 -
 77
77 -
 78
78 -
 79
79 -
 80
80 -
 81
81 -
82
-
83
-
84
-
85
-
86
-
87
-
88
-
89
-
90
-
91
-
92
-
93
-
94
-
95
-
96
-
97
-
98
-
99
-
100
-
101
-
102
-
103
-
104
-
105
-
106
-
107
-
108
-
109
-
110
-
111
-
112
-
113
-
114
-
115
-
116
-
117
-
118
-
119
-
120
-
121
-
122
-
123
-
124
-
125
-
126
-
127
-
128
-
129
-
130
-
131
-
132
-
133
-
134
-
135
-
136
-
137
-
138
-
139
-
140
-
141
-
142
-
143
-
144
-
145
-
146
-
147
-
148
-
149
-
150
-
151
-
152
-
153
-
154
-
155
-
156
-
157
-
158
-
159
-
160
-
161
-
162
-
163
-
164
-
165
-
166
-
167
-
168
-
169
-
170
-
171
-
172
-
173
-
174
-
175
-
176
-
177
-
178
-
179
-
180
-
181
-
182
-
183
-
184
-
185
-
186
-
187
-
188
-
189
-
190
-
191
-
192
-
193
-
194
-
195
-
196
-
197
-
198
-
199
-
200
-
201
-
202
-
203
-
204
-
205
-
206
-
207
-
208
-
209
-
210
-
211
-
212
-
213
-
214
-
215
-
216
-
217
-
218
-
219
-
220
-
221
-
222
-
223
-
224
-
225
-
226
-
227
-
228
-
229
-
230
-
231
-
232
-
233
-
234
-
235
-
236
-
237
-
238
-
239
-
240
-
241
-
242
-
243
-
244
-
245
-
246
-
247
-
248
-
249
-
250
-
251
-
252
-
253
-
254
-
255
-
256
-
257
-
258
-
259
-
260
-
261
-
262
-
263
-
264
-
265
-
266
-
267
 |
 |
71
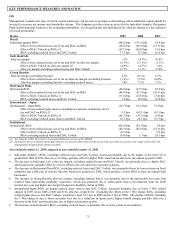
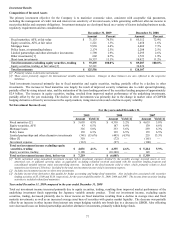
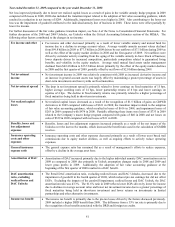
Renewal earned pricing increase (decrease)
Written premiums are earned over the policy term, which is six months for certain Personal Lines auto business and 12 months for
substantially all of the remainder of the Company’ s business. Because the Company earns premiums over the 6 to 12 month term of the
policies, renewal earned pricing increases (decreases) lag renewal written pricing increases (decreases) by 6 to 12 months.
New business written premium
New business written premium represents the amount of premiums charged for policies issues to customers who were not insured with
the Company in the previous policy term. New business written premium plus renewal policy written premium equals total written
premium.
Policy count retention
Policy count retention represents the ratio of the number of policies renewed during the period divided by the number of policies from
the previous policy term period. The number of policies available to renew from the previous policy term represents the number of
policies written in the previous policy term net of any cancellations of those policies. Policy count retention is affected by a number of
factors, including the percentage of renewal policy quotes accepted and decisions by the Company to non-renew policies because of
specific policy underwriting concerns or because of a decision to reduce premium writings in certain classes of business or states.
Policy count retention is also affected by advertising and rate actions taken by competitors.
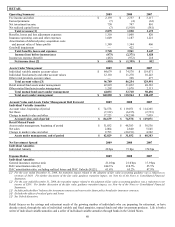
Loss and loss adjustment expense ratio
The loss and loss adjustment expense ratio is a measure of the cost of claims incurred in the calendar year divided by earned premium
and includes losses incurred for both the current and prior accident years. Among other factors, the loss and loss adjustment expense
ratio needed for the Company to achieve its targeted return on equity fluctuates from year to year based on changes in the expected
investment yield over the claim settlement period, the timing of expected claim settlements and the targeted returns set by management
based on the competitive environment.
The loss and loss adjustment expense ratio is affected by claim frequency and claim severity, particularly for shorter-tail property lines
of business, where the emergence of claim frequency and severity is credible and likely indicative of ultimate losses. Claim frequency
represents the percentage change in the average number of reported claims per unit of exposure in the current accident year compared to
that of the previous accident year. Claim severity represents the percentage change in the estimated average cost per claim in the current
accident year compared to that of the previous accident year. As one of the factors used to determine pricing, the Company’ s practice is
to first make an overall assumption about claim frequency and severity for a given line of business and then, as part of the ratemaking
process, adjust the assumption as appropriate for the particular state, product or coverage.
Current accident year loss and loss adjustment expense ratio before catastrophes
The current accident year loss and loss adjustment expense ratio before catastrophes is a measure of the cost of non-catastrophe claims
incurred in the current accident year divided by earned premiums. Management believes that the current accident year loss and loss
adjustment expense ratio before catastrophes is a performance measure that is useful to investors as it removes the impact of volatile and
unpredictable catastrophe losses and prior accident year reserve development.
Prior accident year loss and loss adjustment expense ratio
The prior year loss and loss adjustment expense ratio represents the increase (decrease) in the estimated cost of settling catastrophe and
non-catastrophe claims incurred in prior accident years as recorded in the current calendar year divided by earned premiums.
Expense ratio
The expense ratio is the ratio of underwriting expenses, excluding bad debt expense, to earned premiums. Underwriting expenses
include the amortization of deferred policy acquisition costs and insurance operating costs and expenses. Deferred policy acquisition
costs include commissions, taxes, licenses and fees and other underwriting expenses and are amortized over the policy term.
Policyholder dividend ratio
The policyholder dividend ratio is the ratio of policyholder dividends to earned premium.
Combined ratio
The combined ratio is the sum of the loss and loss adjustment expense ratio, the expense ratio and the policyholder dividend ratio. This
ratio is a relative measurement that describes the related cost of losses and expenses for every $100 of earned premiums. A combined
ratio below 100.0 demonstrates underwriting profit; a combined ratio above 100.0 demonstrates underwriting losses.
Catastrophe ratio
The catastrophe ratio (a component of the loss and loss adjustment expense ratio) represents the ratio of catastrophe losses incurred in
the current calendar year (net of reinsurance) to earned premiums and includes catastrophe losses incurred for both the current and prior
accident years. A catastrophe is an event that causes $25 or more in industry insured property losses and affects a significant number of
property and casualty policyholders and insurers. The catastrophe ratio includes the effect of catastrophe losses, but does not include the
effect of reinstatement premiums.