The Hartford 2009 Annual Report Download - page 121
Download and view the complete annual report
Please find page 121 of the 2009 The Hartford annual report below. You can navigate through the pages in the report by either clicking on the pages listed below, or by using the keyword search tool below to find specific information within the annual report.-
 1
1 -
2
-
3
-
4
-
5
-
6
-
7
-
8
-
9
-
10
-
11
-
12
-
13
-
14
-
15
-
16
-
17
-
18
-
19
-
20
-
21
-
22
-
23
-
24
-
25
-
26
-
27
-
28
-
29
-
30
-
31
-
32
-
33
-
34
-
35
-
36
-
37
-
38
-
39
-
40
-
41
-
42
-
43
-
44
-
45
-
46
-
47
-
48
-
49
-
50
-
51
-
52
-
53
-
54
-
55
-
56
-
57
-
58
-
59
-
60
-
61
-
62
-
63
-
64
-
65
-
66
-
67
-
68
-
69
-
70
-
71
-
72
-
73
-
74
-
75
-
76
-
77
-
78
-
79
-
80
-
81
-
82
-
83
-
84
-
85
-
86
-
87
-
88
-
89
-
90
-
91
-
92
-
93
-
94
-
95
-
96
-
97
-
98
-
99
-
100
-
101
-
102
-
103
-
104
-
105
-
106
-
107
-
108
-
109
-
110
-
 111
111 -
 112
112 -
 113
113 -
 114
114 -
 115
115 -
 116
116 -
 117
117 -
 118
118 -
 119
119 -
 120
120 -
 121
121 -
 122
122 -
 123
123 -
 124
124 -
 125
125 -
 126
126 -
 127
127 -
 128
128 -
 129
129 -
 130
130 -
 131
131 -
132
-
133
-
134
-
135
-
136
-
137
-
138
-
139
-
140
-
141
-
142
-
143
-
144
-
145
-
146
-
147
-
148
-
149
-
150
-
151
-
152
-
153
-
154
-
155
-
156
-
157
-
158
-
159
-
160
-
161
-
162
-
163
-
164
-
165
-
166
-
167
-
168
-
169
-
170
-
171
-
172
-
173
-
174
-
175
-
176
-
177
-
178
-
179
-
180
-
181
-
182
-
183
-
184
-
185
-
186
-
187
-
188
-
189
-
190
-
191
-
192
-
193
-
194
-
195
-
196
-
197
-
198
-
199
-
200
-
201
-
202
-
203
-
204
-
205
-
206
-
207
-
208
-
209
-
210
-
211
-
212
-
213
-
214
-
215
-
216
-
217
-
218
-
219
-
220
-
221
-
222
-
223
-
224
-
225
-
226
-
227
-
228
-
229
-
230
-
231
-
232
-
233
-
234
-
235
-
236
-
237
-
238
-
239
-
240
-
241
-
242
-
243
-
244
-
245
-
246
-
247
-
248
-
249
-
250
-
251
-
252
-
253
-
254
-
255
-
256
-
257
-
258
-
259
-
260
-
261
-
262
-
263
-
264
-
265
-
266
-
267
 |
 |

121
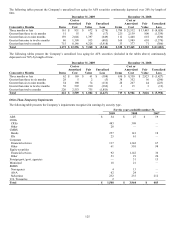
December 31, 2008
AAA AA A BBB
BB and Below Total
Amortized
Cost
Fair
Value
Amortized
Cost
Fair
Value
Amortized
Cost
Fair
Value
Amortized
Cost
Fair
Value
Amortized
Cost
Fair
Value
Amortized
Cost
Fair
Value
2003 & Prior $ 49 $ 41 $ 162 $ 136 $ 60 $ 43 $ 32 $ 26 $ 34 $ 20 $ 337 $ 266
2004 112 81 349 277 8 7 10 7 — — 479 372
2005 90 71 543 367 154 77 24 16 23 18 834 549
2006 77 69 126 56 18 9 120 50 143 54 484 238
2007 42 27 40 10 38 18 47 26 134 75 301 156
Total $ 370 $ 289 $ 1,220 $ 846 $ 278 $ 154 $ 233 $ 125 $ 334 $ 167 $ 2,435 $ 1,581
Credit
protection 40.5% 47.6% 31.4% 21.9% 19.9% 41.0%
[1] The vintage year represents the year the underlying loans in the pool were originated.
[2] Includes second lien residential mortgages with an amortized cost and fair value of $42 and $34, respectively, as of December 31, 2009 and $173
and $82, respectively, as of December 31, 2008, which are composed primarily of loans to prime and Alt-A borrowers.
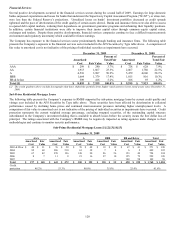
[3] As of December 31, 2009, the weighted average life of the sub-prime residential mortgage portfolio was 4.1 years.
[4] Approximately 93% of the portfolio is backed by adjustable rate mortgages.
[5] The credit qualities above include downgrades that have shifted the portfolio from higher rated assets to lower rated assets since December 31,
2008.
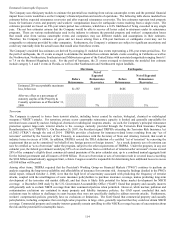
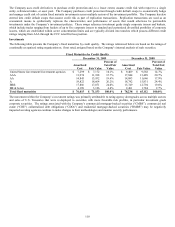
Commercial Mortgage Loans
The Company observed significant pressure on commercial real estate market fundamentals throughout 2009 including increased
vacancies, rising delinquencies and declining property values and expects continued pressure in the upcoming year. The following
tables present the Company’ s exposure to CMBS bonds, CRE CDOs and CMBS IOs by current credit quality and vintage year, included
in the AFS Securities by Type table above. A comparison of fair value to amortized cost is not indicative of the pricing of individual
securities as impairments have occurred. Credit protection represents the current weighted average percentage of the outstanding capital
structure subordinated to the Company’ s investment holding that is available to absorb losses before the security incurs the first dollar
loss of principal. This credit protection does not include any equity interest or property value in excess of outstanding debt. The ratings
associated with the Company’ s CMBS and CRE CDOs may be negatively impacted as rating agencies continue to make changes to their
methodologies and monitor security performance.
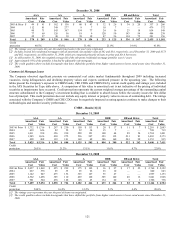
CMBS – Bonds [1] [2]
December 31, 2009
AAA AA A BBB
BB and Below Total
Amortized
Cost
Fair
Value
Amortized
Cost
Fair
Value
Amortized
Cost
Fair
Value
Amortized
Cost
Fair
Value
Amortized
Cost
Fair
Value
Amortized
Cost
Fair
Value
2003 & Prior $ 1,732 $ 1,716 $ 297 $ 230 $ 150 $ 113 $ 20 $ 17 $ 11 $ 7 $ 2,210 $ 2,083
2004 639 626 82 52 52 34 15 7 — — 788 719
2005 1,011 930 356 230 228 123 100 64 89 54 1,784 1,401
2006 1,945 1,636 430 275 536 247 323 132 231 83 3,465 2,373
2007 498 408 139 101 169 68 346 160 201 98 1,353 835
Total $ 5,825 $ 5,316 $ 1,304 $ 888 $ 1,135 $ 585 $ 804 $ 380 $ 532 $ 242 $ 9,600 $ 7,411
Credit
protection 26.5% 21.2% 13.1% 11.6% 8.7% 22.0%
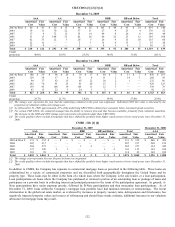
December 31, 2008
AAA AA A BBB
BB and Below Total
Amortized
Cost
Fair
Value
Amortized
Cost
Fair
Value
Amortized
Cost
Fair
Value
Amortized
Cost
Fair
Value
Amortized
Cost
Fair
Value
Amortized
Cost
Fair
Value
2003 & Prior $ 2,057 $ 1,869 $ 455 $ 299 $ 175 $ 102 $ 36 $ 27 $ 37 $ 25 $ 2,760 $ 2,322
2004 667 576 85 35 65 22 23 10 — — 840 643
2005 1,142 847 475 152 325 127 55 27 — — 1,997 1,153
2006 2,562 1,498 385 110 469 168 385 140 40 12 3,841 1,928
2007 981 504 438 128 148 45 134 60 5 1 1,706 738
Total $ 7,409 $ 5,294 $ 1,838 $ 724 $ 1,182 $ 464 $ 633 $ 264 $ 82 $ 38 $ 11,144 $ 6,784
Credit
protection 24.4% 16.4% 12.2% 5.3% 4.4% 20.6%
[1] The vintage year represents the year the pool of loans was originated.
[2] The credit qualities above include downgrades that have shifted the portfolio from higher rated assets to lower rated assets since December 31,
2008.