The Hartford 2009 Annual Report Download - page 82
Download and view the complete annual report
Please find page 82 of the 2009 The Hartford annual report below. You can navigate through the pages in the report by either clicking on the pages listed below, or by using the keyword search tool below to find specific information within the annual report.-
 1
1 -
2
-
3
-
4
-
5
-
6
-
7
-
8
-
9
-
10
-
11
-
12
-
13
-
14
-
15
-
16
-
17
-
18
-
19
-
20
-
21
-
22
-
23
-
24
-
25
-
26
-
27
-
28
-
29
-
30
-
31
-
32
-
33
-
34
-
35
-
36
-
37
-
38
-
39
-
40
-
41
-
42
-
43
-
44
-
45
-
46
-
47
-
48
-
49
-
50
-
51
-
52
-
53
-
54
-
55
-
56
-
57
-
58
-
59
-
60
-
61
-
62
-
63
-
64
-
65
-
66
-
67
-
68
-
69
-
70
-
71
-
 72
72 -
 73
73 -
 74
74 -
 75
75 -
 76
76 -
 77
77 -
 78
78 -
 79
79 -
 80
80 -
 81
81 -
 82
82 -
 83
83 -
 84
84 -
 85
85 -
 86
86 -
 87
87 -
 88
88 -
 89
89 -
 90
90 -
 91
91 -
 92
92 -
93
-
94
-
95
-
96
-
97
-
98
-
99
-
100
-
101
-
102
-
103
-
104
-
105
-
106
-
107
-
108
-
109
-
110
-
111
-
112
-
113
-
114
-
115
-
116
-
117
-
118
-
119
-
120
-
121
-
122
-
123
-
124
-
125
-
126
-
127
-
128
-
129
-
130
-
131
-
132
-
133
-
134
-
135
-
136
-
137
-
138
-
139
-
140
-
141
-
142
-
143
-
144
-
145
-
146
-
147
-
148
-
149
-
150
-
151
-
152
-
153
-
154
-
155
-
156
-
157
-
158
-
159
-
160
-
161
-
162
-
163
-
164
-
165
-
166
-
167
-
168
-
169
-
170
-
171
-
172
-
173
-
174
-
175
-
176
-
177
-
178
-
179
-
180
-
181
-
182
-
183
-
184
-
185
-
186
-
187
-
188
-
189
-
190
-
191
-
192
-
193
-
194
-
195
-
196
-
197
-
198
-
199
-
200
-
201
-
202
-
203
-
204
-
205
-
206
-
207
-
208
-
209
-
210
-
211
-
212
-
213
-
214
-
215
-
216
-
217
-
218
-
219
-
220
-
221
-
222
-
223
-
224
-
225
-
226
-
227
-
228
-
229
-
230
-
231
-
232
-
233
-
234
-
235
-
236
-
237
-
238
-
239
-
240
-
241
-
242
-
243
-
244
-
245
-
246
-
247
-
248
-
249
-
250
-
251
-
252
-
253
-
254
-
255
-
256
-
257
-
258
-
259
-
260
-
261
-
262
-
263
-
264
-
265
-
266
-
267
 |
 |

82
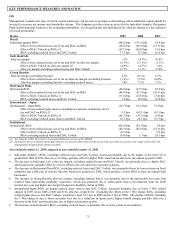
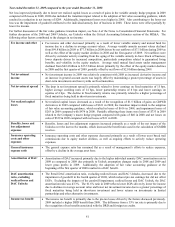
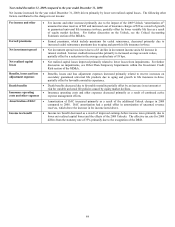
Year ended December 31, 2008 compared to the year ended December 31, 2007
Net income decreased primarily as a result of increased realized capital losses, the impact of the 2008 Unlock charge, the impairment of
goodwill attributed to the individual annuity line of business and the effect of equity market declines on variable annuity and mutual
fund fee income. For further discussion of the fair value accounting guidance transition impact, see Note 4 of the Notes to Consolidated
Financial Statements. For further discussion of the 2008 and 2007 Unlock, see Unlocks within the Critical Accounting Estimates
section of the MD&A. For further discussion of goodwill impairments, see Note 8 of the Notes to Consolidated Financial Statements.
The following other factors contributed to the changes in net income:
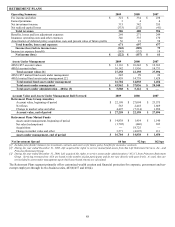
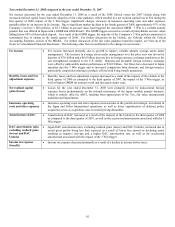
Fee income and other • Fee income and other decreased $360 primarily as a result of lower variable annuity fee income due to a
decline in average account values. The decrease in average variable annuity account values can be
attributed to market depreciation of $38.2 billion and net outflows of $6.2 billion during the year. Net
outflows were driven by surrender activity resulting from the aging of the variable annuity in-force block
of business; increased competition, particularly competition related to guaranteed living benefits, and
volatility in the equity markets. Also contributing to the decrease in fee income was lower mutual fund
fees due to declining assets under management primarily driven by market depreciation of $20.1 billion,
partially offset by $2.8 billion of net flows.
Earned premiums • Earned Premiums increased primarily due to an increase in life contingent premiums combined with a
decrease in reinsurance premiums as a result of the lapsing of business covered by reinsurance and the
significant decline in the equity markets.
Net investment
income
• Net investment income was lower primarily due to a $77 decline in income from limited partnerships
and other alternative investments, combined with lower yields on fixed maturity investments due to
interest rate declines, partially offset by an increase in general account assets from increased fixed
account sales.
Net investment spread • The decline in net investment spread is attributable to lower fixed income returns of 62 bps and lower
limited partnership returns of 45 bps, partially offset by a reduction in the average credited rate of 3 bps.
The decline in fixed maturity returns was primarily related to a higher percentage of fixed maturities
being held in short-term investments.
Net realized capital
losses
• Net realized capital losses increased primarily as a result of losses on GMWB derivatives of $631 in
2008 compared with losses of $286 in 2007; the transition impact related to the adoption of fair value
accounting guidance, which resulted in losses of $616 in 2008; and impairments of $474 in 2008
compared with $87 in 2007.
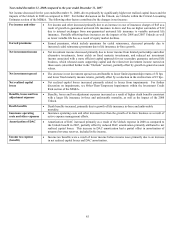
Benefits, losses and
loss adjustment
expenses
• Benefits, losses and loss adjustment expenses increased primarily as a result of the impact of the 2008
Unlock which increased the benefit ratio used in the calculation of GMDB reserves.
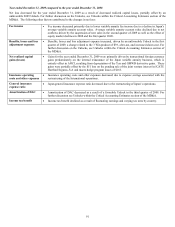
Insurance operating
costs and other
expenses
• Insurance operating costs and other expenses decreased primarily as a result of lower non deferrable
asset based trail commissions due to equity market declines.
General insurance
expense ratio
• The general insurance expense ratio increased due to the impact of a declining asset base on relatively
consistent expenses.
Amortization of DAC • Amortization of DAC increased primarily due to the impact of the 2008 Unlock charge as compared to
the 2007 Unlock benefit. This was partially offset by a DAC benefit associated with the adoption of fair
value accounting guidance at the beginning of the first quarter of 2008.
DAC amortization
ratio, excluding
realized losses and
DAC Unlocks
• The Retail DAC amortization ratio, excluding realized losses and DAC Unlocks, increased due to the
impairment of goodwill in the fourth quarter of 2008, which reduced pre-tax earnings but did not affect
EGPs. Excluding the impacts of the goodwill impairment, realized losses, and DAC Unlock, the 2008
DAC amortization ratio was 43.3%, which reflects the 2008 effect of changes in assumptions made as
part of the 2007 and 2008 Unlocks.
Goodwill impairment • As a result of testing performed during the fourth quarter of 2008, all goodwill attributed to the
individual annuity business in Retail was deemed to be impaired and was written down to $0. For
further discussion of this impairment, see Note 8 in the Notes to Consolidated Financial Statements.
Income tax expense
(benefit)
• The effective tax rate increased from 21% to 41% for the year ended December 31, 2008 as compared to
the prior year primarily due to losses before income taxes in 2008 compared to pre-tax earnings in 2007.
The impact of DRD and other permanent differences caused an increase in the tax benefit to above 35%
on the 2008 pre-tax loss and a decrease in the tax expense on the 2007 pre-tax income.