The Hartford 2009 Annual Report Download - page 59
Download and view the complete annual report
Please find page 59 of the 2009 The Hartford annual report below. You can navigate through the pages in the report by either clicking on the pages listed below, or by using the keyword search tool below to find specific information within the annual report.-
 1
1 -
2
-
3
-
4
-
5
-
6
-
7
-
8
-
9
-
10
-
11
-
12
-
13
-
14
-
15
-
16
-
17
-
18
-
19
-
20
-
21
-
22
-
23
-
24
-
25
-
26
-
27
-
28
-
29
-
30
-
31
-
32
-
33
-
34
-
35
-
36
-
37
-
38
-
39
-
40
-
41
-
42
-
43
-
44
-
45
-
46
-
47
-
48
-
 49
49 -
 50
50 -
 51
51 -
 52
52 -
 53
53 -
 54
54 -
 55
55 -
 56
56 -
 57
57 -
 58
58 -
 59
59 -
 60
60 -
 61
61 -
 62
62 -
 63
63 -
 64
64 -
 65
65 -
 66
66 -
 67
67 -
 68
68 -
 69
69 -
70
-
71
-
72
-
73
-
74
-
75
-
76
-
77
-
78
-
79
-
80
-
81
-
82
-
83
-
84
-
85
-
86
-
87
-
88
-
89
-
90
-
91
-
92
-
93
-
94
-
95
-
96
-
97
-
98
-
99
-
100
-
101
-
102
-
103
-
104
-
105
-
106
-
107
-
108
-
109
-
110
-
111
-
112
-
113
-
114
-
115
-
116
-
117
-
118
-
119
-
120
-
121
-
122
-
123
-
124
-
125
-
126
-
127
-
128
-
129
-
130
-
131
-
132
-
133
-
134
-
135
-
136
-
137
-
138
-
139
-
140
-
141
-
142
-
143
-
144
-
145
-
146
-
147
-
148
-
149
-
150
-
151
-
152
-
153
-
154
-
155
-
156
-
157
-
158
-
159
-
160
-
161
-
162
-
163
-
164
-
165
-
166
-
167
-
168
-
169
-
170
-
171
-
172
-
173
-
174
-
175
-
176
-
177
-
178
-
179
-
180
-
181
-
182
-
183
-
184
-
185
-
186
-
187
-
188
-
189
-
190
-
191
-
192
-
193
-
194
-
195
-
196
-
197
-
198
-
199
-
200
-
201
-
202
-
203
-
204
-
205
-
206
-
207
-
208
-
209
-
210
-
211
-
212
-
213
-
214
-
215
-
216
-
217
-
218
-
219
-
220
-
221
-
222
-
223
-
224
-
225
-
226
-
227
-
228
-
229
-
230
-
231
-
232
-
233
-
234
-
235
-
236
-
237
-
238
-
239
-
240
-
241
-
242
-
243
-
244
-
245
-
246
-
247
-
248
-
249
-
250
-
251
-
252
-
253
-
254
-
255
-
256
-
257
-
258
-
259
-
260
-
261
-
262
-
263
-
264
-
265
-
266
-
267
 |
 |

59
An Unlock revises EGPs, on a quarterly basis, to reflect the Company's current best estimate assumptions. After each quarterly Unlock,
the Company also tests the aggregate recoverability of DAC by comparing the DAC balance to the present value of future EGPs. As of
December 31, 2009, the margin between the DAC balance and the present value of future EGPs was 23% and 59% for U.S. and Japan
individual variable annuities, respectively. If the margin between the DAC asset and the present value of future EGPs is exhausted,
further reductions in EGPs would cause portions of DAC to be unrecoverable.
Estimated gross profits are also used to determine the expected excess benefits and assessments included in the measurement of death
and other insurance benefit reserves. These excess benefits and assessments are derived from a range of stochastic scenarios that have
been calibrated to the Company’ s RTM separate account returns. The determination of death and other insurance benefit reserves is also
impacted by discount rates, lapses, volatilities and mortality assumptions.
Unlocks
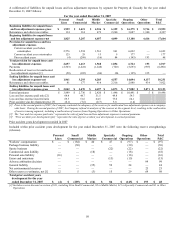
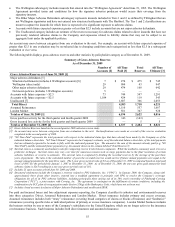
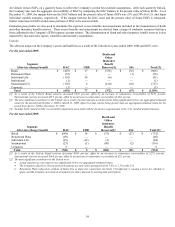
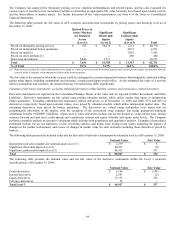
The after-tax impact on the Company’ s assets and liabilities as a result of the Unlocks for years ended 2009, 2008 and 2007, were:
For the year ended 2009:
Segment
After-tax (charge) benefit DAC URR
Death and
Other
Insurance
Benefit
Reserves[1] SIA Total [2]
Retail $ (429) $ 17 $ (158) $ (36) $ (606)
Retirement Plans (55) — — (1) (56)
Individual Life (101) 54 (4) — (51)
Institutional (1) — — — (1)
International [3] (103) 6 (210) (10) (317)
Corporate (3) — — — (3)
Total $ (692) $ 77 $ (372) $ (47) $ (1,034)
[1] As a result of the Unlock, Retail reserves increased $522, pre-tax, offset by an increase in reinsurance recoverables of $279, pre-tax.
International reserves increased $357, pre-tax, offset by an increase in reinsurance recoverables of $34, pre-tax.
[2] The most significant contributor to the Unlock was a result of actual separate account returns being significantly below our aggregated estimated
return for the period from October 1, 2008 to March 31, 2009, offset by actual returns being greater than our aggregated estimated return for the
period from April 1, 2009 to December 31, 2009.
[3] Includes $(49) related to DAC recoverability impairment associated with the decision to suspend sales in the U.K. variable annuity business.
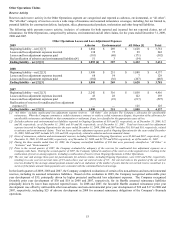
For the year ended 2008:
Segment
After-tax (charge) benefit DAC URR
Death and
Other
Insurance
Benefit
Reserves[1] SIA Total [2]
Retail $ (648) $ 18 $ (75) $ (27) $ (732)
Retirement Plans (49) — — — (49)
Individual Life (29) (12) (3) — (44)
International (23) (1) (90) (2) (116)
Corporate 9 — — — 9
Total $ (740) $ 5 $ (168) $ (29) $ (932)
[1] As a result of the Unlock, Retail reserves increased $389, pre-tax, offset by an increase in reinsurance recoverables of $273, pre-tax.
International reserves increased $164, pre-tax, offset by an increase in reinsurance recoverables of $25, pre-tax.
[2] The most significant contributors to the Unlock were:
• Actual separate account returns were significantly below our aggregated estimated return.
• The Company reduced its 20-year projected separate account return assumption from 7.8% to 7.2% in the U.S.
• Retirement Plans reduced its estimate of future fees as plans met contractual size limits (“breakpoints”), causing a lower fee schedule to
apply, and the Company increased its assumption for future deposits by existing plan participants.