The Hartford 2009 Annual Report Download - page 84
Download and view the complete annual report
Please find page 84 of the 2009 The Hartford annual report below. You can navigate through the pages in the report by either clicking on the pages listed below, or by using the keyword search tool below to find specific information within the annual report.-
 1
1 -
2
-
3
-
4
-
5
-
6
-
7
-
8
-
9
-
10
-
11
-
12
-
13
-
14
-
15
-
16
-
17
-
18
-
19
-
20
-
21
-
22
-
23
-
24
-
25
-
26
-
27
-
28
-
29
-
30
-
31
-
32
-
33
-
34
-
35
-
36
-
37
-
38
-
39
-
40
-
41
-
42
-
43
-
44
-
45
-
46
-
47
-
48
-
49
-
50
-
51
-
52
-
53
-
54
-
55
-
56
-
57
-
58
-
59
-
60
-
61
-
62
-
63
-
64
-
65
-
66
-
67
-
68
-
69
-
70
-
71
-
72
-
73
-
 74
74 -
 75
75 -
 76
76 -
 77
77 -
 78
78 -
 79
79 -
 80
80 -
 81
81 -
 82
82 -
 83
83 -
 84
84 -
 85
85 -
 86
86 -
 87
87 -
 88
88 -
 89
89 -
 90
90 -
 91
91 -
 92
92 -
 93
93 -
 94
94 -
95
-
96
-
97
-
98
-
99
-
100
-
101
-
102
-
103
-
104
-
105
-
106
-
107
-
108
-
109
-
110
-
111
-
112
-
113
-
114
-
115
-
116
-
117
-
118
-
119
-
120
-
121
-
122
-
123
-
124
-
125
-
126
-
127
-
128
-
129
-
130
-
131
-
132
-
133
-
134
-
135
-
136
-
137
-
138
-
139
-
140
-
141
-
142
-
143
-
144
-
145
-
146
-
147
-
148
-
149
-
150
-
151
-
152
-
153
-
154
-
155
-
156
-
157
-
158
-
159
-
160
-
161
-
162
-
163
-
164
-
165
-
166
-
167
-
168
-
169
-
170
-
171
-
172
-
173
-
174
-
175
-
176
-
177
-
178
-
179
-
180
-
181
-
182
-
183
-
184
-
185
-
186
-
187
-
188
-
189
-
190
-
191
-
192
-
193
-
194
-
195
-
196
-
197
-
198
-
199
-
200
-
201
-
202
-
203
-
204
-
205
-
206
-
207
-
208
-
209
-
210
-
211
-
212
-
213
-
214
-
215
-
216
-
217
-
218
-
219
-
220
-
221
-
222
-
223
-
224
-
225
-
226
-
227
-
228
-
229
-
230
-
231
-
232
-
233
-
234
-
235
-
236
-
237
-
238
-
239
-
240
-
241
-
242
-
243
-
244
-
245
-
246
-
247
-
248
-
249
-
250
-
251
-
252
-
253
-
254
-
255
-
256
-
257
-
258
-
259
-
260
-
261
-
262
-
263
-
264
-
265
-
266
-
267
 |
 |

84
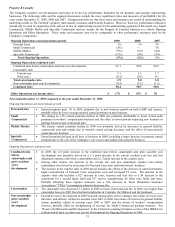
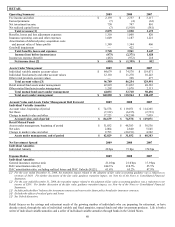
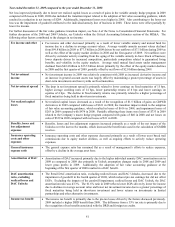
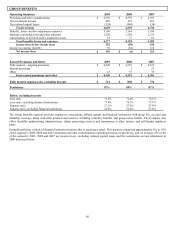
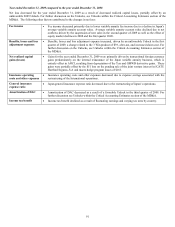
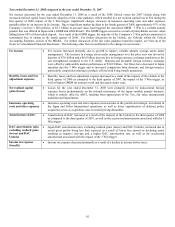
Year ended December 31, 2009 compared to the year ended December 31, 2008
Net income increased for the year ended December 31, 2009, driven primarily by lower net realized capital losses. The following other
factors contributed to the changes in net income:
Fee income and other • Fee income and other increased primarily due to the impact of the 2009 Unlock “amortization of”
unearned revenue reserves of $83 and increased cost of insurance charges of $38 as a result of growth
in guaranteed universal life insurance in-force, partially offset by lower variable life fees as a result
of equity market declines. For further discussion on the Unlock, see the Critical Accounting
Estimates section of the MD&A.
Earned premiums • Earned premiums, which include premiums for ceded reinsurance, decreased primarily due to
increased ceded reinsurance premiums due to aging and growth in life insurance in-force.
Net investment spread • Net investment spread was lower due to a $3 decline in investment income and a $2 increase in
interest credited. Interest credited increased due primarily to increased average account values,
partially offset by a reduction in the average credited rate of 18 bps.
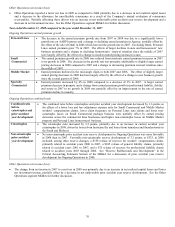
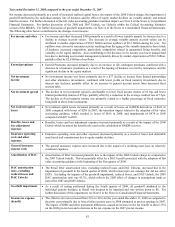
Net realized capital
losses
• Net realized capital losses improved primarily related to lower losses from impairments. For further
discussion on impairments, see Other-Than-Temporary Impairments within the Investment Credit
Risk section of the MD&A.
Benefits, losses and loss
adjustment expenses
• Benefits, losses and loss adjustment expenses increased primarily related to reserve increases on
secondary guaranteed universal life products due to aging and growth in life insurance in-force,
partially offset by favorable mortality experience.
Death benefits • Death benefits decreased due to favorable mortality partially offset by an increase in net amount at
risk for variable universal life policies caused by equity market declines.
Insurance operating
costs and other expenses
• Insurance operating costs and other expenses decreased primarily as a result of continued active
expense management efforts.
Amortization of DAC • Amortization of DAC increased primarily as a result of the additional Unlock charges in 2009
compared to 2008. DAC amortization had a partial offset in amortization of unearned revenue
reserves, which drove the increase in fee income noted above.
Income tax benefit • Income tax benefit decreased as a result of improved earnings before income taxes primarily due to
lower net realized capital losses and the effects of the 2009 Unlocks. The effective tax rate for 2009
differs from the statutory rate of 35% primarily due to the recognition of the DRD.