The Hartford 2009 Annual Report Download - page 187
Download and view the complete annual report
Please find page 187 of the 2009 The Hartford annual report below. You can navigate through the pages in the report by either clicking on the pages listed below, or by using the keyword search tool below to find specific information within the annual report.-
 1
1 -
2
-
3
-
4
-
5
-
6
-
7
-
8
-
9
-
10
-
11
-
12
-
13
-
14
-
15
-
16
-
17
-
18
-
19
-
20
-
21
-
22
-
23
-
24
-
25
-
26
-
27
-
28
-
29
-
30
-
31
-
32
-
33
-
34
-
35
-
36
-
37
-
38
-
39
-
40
-
41
-
42
-
43
-
44
-
45
-
46
-
47
-
48
-
49
-
50
-
51
-
52
-
53
-
54
-
55
-
56
-
57
-
58
-
59
-
60
-
61
-
62
-
63
-
64
-
65
-
66
-
67
-
68
-
69
-
70
-
71
-
72
-
73
-
74
-
75
-
76
-
77
-
78
-
79
-
80
-
81
-
82
-
83
-
84
-
85
-
86
-
87
-
88
-
89
-
90
-
91
-
92
-
93
-
94
-
95
-
96
-
97
-
98
-
99
-
100
-
101
-
102
-
103
-
104
-
105
-
106
-
107
-
108
-
109
-
110
-
111
-
112
-
113
-
114
-
115
-
116
-
117
-
118
-
119
-
120
-
121
-
122
-
123
-
124
-
125
-
126
-
127
-
128
-
129
-
130
-
131
-
132
-
133
-
134
-
135
-
136
-
137
-
138
-
139
-
140
-
141
-
142
-
143
-
144
-
145
-
146
-
147
-
148
-
149
-
150
-
151
-
152
-
153
-
154
-
155
-
156
-
157
-
158
-
159
-
160
-
161
-
162
-
163
-
164
-
165
-
166
-
167
-
168
-
169
-
170
-
171
-
172
-
173
-
174
-
175
-
176
-
 177
177 -
 178
178 -
 179
179 -
 180
180 -
 181
181 -
 182
182 -
 183
183 -
 184
184 -
 185
185 -
 186
186 -
 187
187 -
 188
188 -
 189
189 -
 190
190 -
 191
191 -
 192
192 -
 193
193 -
 194
194 -
 195
195 -
 196
196 -
 197
197 -
198
-
199
-
200
-
201
-
202
-
203
-
204
-
205
-
206
-
207
-
208
-
209
-
210
-
211
-
212
-
213
-
214
-
215
-
216
-
217
-
218
-
219
-
220
-
221
-
222
-
223
-
224
-
225
-
226
-
227
-
228
-
229
-
230
-
231
-
232
-
233
-
234
-
235
-
236
-
237
-
238
-
239
-
240
-
241
-
242
-
243
-
244
-
245
-
246
-
247
-
248
-
249
-
250
-
251
-
252
-
253
-
254
-
255
-
256
-
257
-
258
-
259
-
260
-
261
-
262
-
263
-
264
-
265
-
266
-
267
 |
 |

THE HARTFORD FINANCIAL SERVICES GROUP, INC.
NOTES TO CONSOLIDATED FINANCIAL STATEMENTS (continued)
F-38
5. Investments and Derivative Instruments (continued)
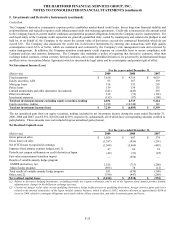
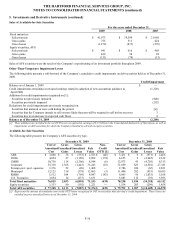
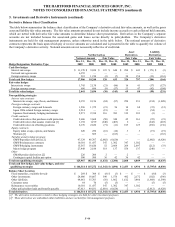
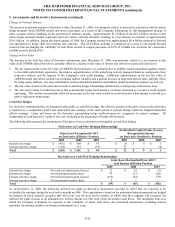
Security Unrealized Loss Aging
The following tables present the Company’ s unrealized loss aging for AFS securities by type and length of time the security was in a
continuous unrealized loss position.
December 31, 2009
Less Than 12 Months 12 Months or More Total
Amortized
Cost
Fair
Value
Unrealized
Losses
Amortized
Cost
Fair
Value
Unrealized
Losses
Amortized
Cost
Fair
Value
Unrealized
Losses
ABS $ 445 $ 376 $ (69) $ 1,574 $ 1,090 $ (484) $ 2,019 $ 1,466 $ (553)
CDOs 1,649 1,418 (231) 2,388 1,430 (958) 4,037 2,848 (1,189)
CMBS 1,951 1,628 (323) 6,330 4,347 (1,983) 8,281 5,975 (2,306)
Corporate 5,715 5,314 (401) 6,675 5,633 (1,042) 12,390 10,947 (1,443)
Foreign govt./govt. agencies 543 530 (13) 43 36 (7) 586 566 (20)
Municipal 2,339 2,283 (56) 2,184 1,862 (322) 4,523 4,145 (378)
RMBS 855 787 (68) 1,927 1,226 (701) 2,782 2,013 (769)
U.S. Treasuries 2,592 2,538 (54) 648 465 (183) 3,240 3,003 (237)
Total fixed maturities 16,089 14,874 (1,215) 21,769 16,089 (5,680) 37,858 30,963 (6,895)
Equity securities 419 356 (63) 676 547 (129) 1,095 903 (192)
Total securities in an unrealized loss $ 16,508 $ 15,230 $ (1,278) $ 22,445 $ 16,636 $ (5,809) $ 38,953 $ 31,866 $ (7,087)
December 31, 2008
Less Than 12 Months 12 Months or More Total
Amortized
Cost
Fair
Value
Unrealized
Losses
Amortized
Cost
Fair
Value
Unrealized
Losses
Amortized
Cost
Fair
Value
Unrealized
Losses
ABS $ 1,190 $ 958 $ (232) $ 2,092 $ 1,353 $ (739) $ 3,282 $ 2,311 $ (971)
CDOs 688 440 (248) 3,941 2,144 (1,797) 4,629 2,584 (2,045)
CMBS 5,704 4,250 (1,454) 6,647 3,398 (3,249) 12,351 7,648 (4,703)
Corporate 16,604 14,145 (2,459) 7,028 4,986 (2,042) 23,632 19,131 (4,501)
Foreign govt./govt. agencies 1,263 1,211 (52) 43 30 (13) 1,306 1,241 (65)
Municipal 5,153 4,640 (513) 2,578 2,138 (440) 7,731 6,778 (953)
RMBS 731 546 (185) 2,607 1,759 (848) 3,338 2,305 (1,033)
U.S. Treasuries 4,120 4,083 (37) 66 64 (2) 4,186 4,147 (39)
Total fixed maturities 35,453 30,273 (5,180) 25,002 15,872 (9,130) 60,455 46,145 (14,310)
Equity securities 1,017 796 (221) 277 199 (78) 1,294 995 (299)
Total securities in an unrealized loss $ 36,470 $ 31,069 $ (5,401) $ 25,279 $ 16,071 $ (9,208) $ 61,749 $ 47,140 $ (14,609)
As of December 31, 2009, AFS securities in an unrealized loss position, comprised of 3,807 securities, primarily related to CMBS,
corporate securities primarily within the financial services sector and CDOs which have experienced significant price deterioration. As
of December 31, 2009, 69% of these securities were depressed less than 20% of amortized cost. The decline in unrealized losses during
2009 was primarily attributable to credit spread tightening, impairments and, to a lesser extent, sales, partially offset by rising interest
rates. The Company neither has an intention to sell nor does it expect to be required to sell the securities outlined above.