The Hartford 2009 Annual Report Download - page 165
Download and view the complete annual report
Please find page 165 of the 2009 The Hartford annual report below. You can navigate through the pages in the report by either clicking on the pages listed below, or by using the keyword search tool below to find specific information within the annual report.-
 1
1 -
2
-
3
-
4
-
5
-
6
-
7
-
8
-
9
-
10
-
11
-
12
-
13
-
14
-
15
-
16
-
17
-
18
-
19
-
20
-
21
-
22
-
23
-
24
-
25
-
26
-
27
-
28
-
29
-
30
-
31
-
32
-
33
-
34
-
35
-
36
-
37
-
38
-
39
-
40
-
41
-
42
-
43
-
44
-
45
-
46
-
47
-
48
-
49
-
50
-
51
-
52
-
53
-
54
-
55
-
56
-
57
-
58
-
59
-
60
-
61
-
62
-
63
-
64
-
65
-
66
-
67
-
68
-
69
-
70
-
71
-
72
-
73
-
74
-
75
-
76
-
77
-
78
-
79
-
80
-
81
-
82
-
83
-
84
-
85
-
86
-
87
-
88
-
89
-
90
-
91
-
92
-
93
-
94
-
95
-
96
-
97
-
98
-
99
-
100
-
101
-
102
-
103
-
104
-
105
-
106
-
107
-
108
-
109
-
110
-
111
-
112
-
113
-
114
-
115
-
116
-
117
-
118
-
119
-
120
-
121
-
122
-
123
-
124
-
125
-
126
-
127
-
128
-
129
-
130
-
131
-
132
-
133
-
134
-
135
-
136
-
137
-
138
-
139
-
140
-
141
-
142
-
143
-
144
-
145
-
146
-
147
-
148
-
149
-
150
-
151
-
152
-
153
-
154
-
 155
155 -
 156
156 -
 157
157 -
 158
158 -
 159
159 -
 160
160 -
 161
161 -
 162
162 -
 163
163 -
 164
164 -
 165
165 -
 166
166 -
 167
167 -
 168
168 -
 169
169 -
 170
170 -
 171
171 -
 172
172 -
 173
173 -
 174
174 -
 175
175 -
176
-
177
-
178
-
179
-
180
-
181
-
182
-
183
-
184
-
185
-
186
-
187
-
188
-
189
-
190
-
191
-
192
-
193
-
194
-
195
-
196
-
197
-
198
-
199
-
200
-
201
-
202
-
203
-
204
-
205
-
206
-
207
-
208
-
209
-
210
-
211
-
212
-
213
-
214
-
215
-
216
-
217
-
218
-
219
-
220
-
221
-
222
-
223
-
224
-
225
-
226
-
227
-
228
-
229
-
230
-
231
-
232
-
233
-
234
-
235
-
236
-
237
-
238
-
239
-
240
-
241
-
242
-
243
-
244
-
245
-
246
-
247
-
248
-
249
-
250
-
251
-
252
-
253
-
254
-
255
-
256
-
257
-
258
-
259
-
260
-
261
-
262
-
263
-
264
-
265
-
266
-
267
 |
 |

THE HARTFORD FINANCIAL SERVICES GROUP, INC.
NOTES TO CONSOLIDATED FINANCIAL STATEMENTS (continued)
F-16
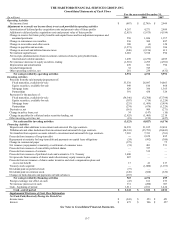
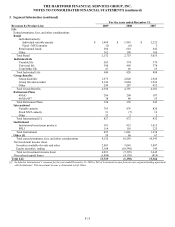
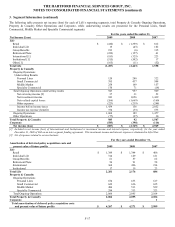
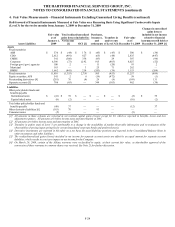
3. Segment Information (continued)
For the years ended December 31,
Revenues by Product Line (continued) 2009 2008 2007
Property & Casualty
Ongoing Operations
Earned premiums
Personal Lines
Automobile $2,850 $2,824 $2,822
Homeowners 1,102 1,102 1,067
Total Personal Lines 3,952 3,926 3,889
Small Commercial
Workers’ Compensation 1,178 1,241 1,230
Package Business 1,123 1,167 1,169
Automobile 279 316 337
Total Small Commercial 2,580 2,724 2,736
Middle Market
Workers’ Compensation 847 847 861
Property 555 611 627
Automobile 288 335 382
Liability 411 506 550
Total Middle Market 2,101 2,299 2,420
Specialty Commercial
Workers’ Compensation 250 288 304
Property 42 86 117
Automobile 86 84 83
Liability 208 241 246
Fidelity and surety 250 272 256
Professional Liability 393 414 429
Other (1) (3) 11
Total Specialty Commercial 1,228 1,382 1,446
Total Ongoing Operations 9,861 10,331 10,491
Other Operations — 7 5
Total earned premiums 9,861 10,338 10,496
Other revenues [1] 492 504 496
Net investment income 1,106 1,253 1,687
Net realized capital losses (294) (1,877) (172)
Total Property & Casualty 11,165 10,218 12,507
Corporate (193) 151 43
Total revenues $24,701 $9,219 $25,916
[1] Represents servicing revenue.
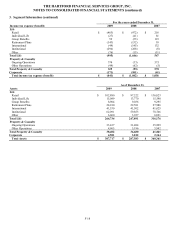
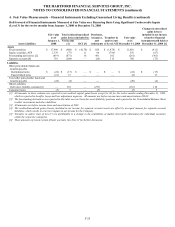
For the years ended December 31,
Geographical Revenue Information 2009 2008 2007
United States of America $20,429 $18,904 $24,842
Japan 3,816 (9,745) 968
Other 456 60 106
Total revenues $24,701 $9,219 $25,916