The Hartford 2009 Annual Report Download - page 124
Download and view the complete annual report
Please find page 124 of the 2009 The Hartford annual report below. You can navigate through the pages in the report by either clicking on the pages listed below, or by using the keyword search tool below to find specific information within the annual report.-
 1
1 -
2
-
3
-
4
-
5
-
6
-
7
-
8
-
9
-
10
-
11
-
12
-
13
-
14
-
15
-
16
-
17
-
18
-
19
-
20
-
21
-
22
-
23
-
24
-
25
-
26
-
27
-
28
-
29
-
30
-
31
-
32
-
33
-
34
-
35
-
36
-
37
-
38
-
39
-
40
-
41
-
42
-
43
-
44
-
45
-
46
-
47
-
48
-
49
-
50
-
51
-
52
-
53
-
54
-
55
-
56
-
57
-
58
-
59
-
60
-
61
-
62
-
63
-
64
-
65
-
66
-
67
-
68
-
69
-
70
-
71
-
72
-
73
-
74
-
75
-
76
-
77
-
78
-
79
-
80
-
81
-
82
-
83
-
84
-
85
-
86
-
87
-
88
-
89
-
90
-
91
-
92
-
93
-
94
-
95
-
96
-
97
-
98
-
99
-
100
-
101
-
102
-
103
-
104
-
105
-
106
-
107
-
108
-
109
-
110
-
111
-
112
-
113
-
 114
114 -
 115
115 -
 116
116 -
 117
117 -
 118
118 -
 119
119 -
 120
120 -
 121
121 -
 122
122 -
 123
123 -
 124
124 -
 125
125 -
 126
126 -
 127
127 -
 128
128 -
 129
129 -
 130
130 -
 131
131 -
 132
132 -
 133
133 -
 134
134 -
135
-
136
-
137
-
138
-
139
-
140
-
141
-
142
-
143
-
144
-
145
-
146
-
147
-
148
-
149
-
150
-
151
-
152
-
153
-
154
-
155
-
156
-
157
-
158
-
159
-
160
-
161
-
162
-
163
-
164
-
165
-
166
-
167
-
168
-
169
-
170
-
171
-
172
-
173
-
174
-
175
-
176
-
177
-
178
-
179
-
180
-
181
-
182
-
183
-
184
-
185
-
186
-
187
-
188
-
189
-
190
-
191
-
192
-
193
-
194
-
195
-
196
-
197
-
198
-
199
-
200
-
201
-
202
-
203
-
204
-
205
-
206
-
207
-
208
-
209
-
210
-
211
-
212
-
213
-
214
-
215
-
216
-
217
-
218
-
219
-
220
-
221
-
222
-
223
-
224
-
225
-
226
-
227
-
228
-
229
-
230
-
231
-
232
-
233
-
234
-
235
-
236
-
237
-
238
-
239
-
240
-
241
-
242
-
243
-
244
-
245
-
246
-
247
-
248
-
249
-
250
-
251
-
252
-
253
-
254
-
255
-
256
-
257
-
258
-
259
-
260
-
261
-
262
-
263
-
264
-
265
-
266
-
267
 |
 |

124
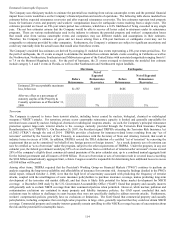
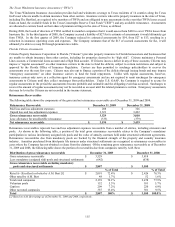
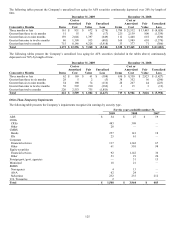
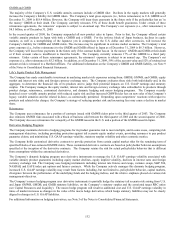
Limited Partnerships and Other Alternative Investments
The following table presents the Company’ s investments in limited partnerships and other alternative investments which include hedge
funds, mortgage and real estate funds, mezzanine debt funds, and private equity and other funds. Hedge funds include investments in
funds of funds and direct funds. Mortgage and real estate funds consist of investments in funds whose assets consist of mortgage loans,
mortgage loan participations, mezzanine loans or other notes which may be below investment grade quality, as well as equity real estate
and real estate joint ventures. Mezzanine debt funds include investments in funds whose assets consist of subordinated debt that often
incorporates equity-based options such as warrants and a limited amount of direct equity investments. Private equity and other funds
primarily consist of investments in funds whose assets typically consist of a diversified pool of investments in small non-public
businesses with high growth potential.
December 31, 2009 December 31, 2008
Amount Percent
Amount Percent
Hedge funds $ 596 33.3% $ 834 36.3%
Mortgage and real estate funds 302 16.9% 551 24.0%
Mezzanine debt funds 133 7.4% 156 6.8%
Private equity and other funds 759 42.4% 754 32.9%
Total $ 1,790 100.0% $ 2,295 100.0%
Limited partnerships and other alternative investments decreased primarily due to hedge fund redemptions and negative re-valuations of
the underlying investments associated primarily with the real estate markets.
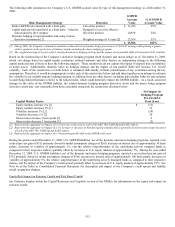
Security Unrealized Loss Aging
As part of the Company’ s ongoing security monitoring process, the Company has reviewed its AFS securities in an unrealized loss
position and concluded that there were no additional impairments as of December 31, 2009 and 2008 and that these securities have
sufficient expected future cash flows to recover the entire amortized cost basis, are temporarily depressed and are expected to recover in
value as the securities approach maturity or as CMBS and sub-prime RMBS market spreads return to more normalized levels.
Most of the securities depressed over 20% for nine months or more are supported by real estate related assets, specifically investment
grade CMBS bonds, sub-prime RMBS and CRE CDOs, and have a weighted average current rating of A. Current market spreads
continue to be significantly wider for securities supported by real estate related assets, as compared to spreads at the security’ s
respective purchase date, largely due to the continued effects of the recession and the economic and market uncertainties regarding
future performance of commercial and residential real estate. The Company reviewed these securities as part of its impairment
evaluation process. The Company’ s best estimate of future cash flows utilized in its impairment process involves both macroeconomic
and security specific assumptions that may differ based on asset class, vintage year and property location including, but not limited to,
historical and projected default and recovery rates, current and expected future delinquency rates, property value declines and the impact
of obligor re-financing. For these securities in an unrealized loss position where a credit impairment has not been recorded, the
Company’ s best estimate of expected future cash flows are sufficient to recover the amortized cost basis of the security.
For further discussion on the Company’ s ongoing security monitoring process and the factors considered in determining whether a
credit impairment exists, see the Recognition and Presentation of Other-Than-Temporary Impairments section in Note 5 of the Notes to
Consolidated Financial Statements.
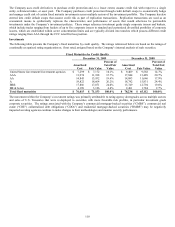
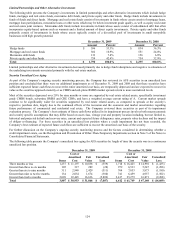
The following table presents the Company’ s unrealized loss aging for AFS securities by length of time the security was in a continuous
unrealized loss position.
December 31, 2009 December 31, 2008
Items
Cost or
Amortized
Cost
Fair
Value
Unrealized
Loss
Items
Cost or
Amortized
Cost
Fair
Value
Unrealized
Loss
Three months or less 1,237 $ 11,197 $ 10,838 $ (359) 1,718 $ 16,425 $ 14,992 $ (1,433)
Greater than three to six months 105 317 289 (28) 972 6,533 5,247 (1,286)
Greater than six to nine months 311 2,940 2,429 (511) 764 7,053 5,873 (1,180)
Greater than nine to twelve months 134 2,054 1,674 (380) 741 6,459 4,957 (1,502)
Greater than twelve months 2,020 22,445 16,636 (5,809) 2,417 25,279 16,071 (9,208)
Total 3,807 $ 38,953 $ 31,866 $ (7,087) 6,612 $ 61,749 $ 47,140 $ (14,609)