The Hartford 2009 Annual Report Download - page 16
Download and view the complete annual report
Please find page 16 of the 2009 The Hartford annual report below. You can navigate through the pages in the report by either clicking on the pages listed below, or by using the keyword search tool below to find specific information within the annual report.-
 1
1 -
2
-
3
-
4
-
5
-
 6
6 -
 7
7 -
 8
8 -
 9
9 -
 10
10 -
 11
11 -
 12
12 -
 13
13 -
 14
14 -
 15
15 -
 16
16 -
 17
17 -
 18
18 -
 19
19 -
 20
20 -
 21
21 -
 22
22 -
 23
23 -
 24
24 -
 25
25 -
 26
26 -
27
-
28
-
29
-
30
-
31
-
32
-
33
-
34
-
35
-
36
-
37
-
38
-
39
-
40
-
41
-
42
-
43
-
44
-
45
-
46
-
47
-
48
-
49
-
50
-
51
-
52
-
53
-
54
-
55
-
56
-
57
-
58
-
59
-
60
-
61
-
62
-
63
-
64
-
65
-
66
-
67
-
68
-
69
-
70
-
71
-
72
-
73
-
74
-
75
-
76
-
77
-
78
-
79
-
80
-
81
-
82
-
83
-
84
-
85
-
86
-
87
-
88
-
89
-
90
-
91
-
92
-
93
-
94
-
95
-
96
-
97
-
98
-
99
-
100
-
101
-
102
-
103
-
104
-
105
-
106
-
107
-
108
-
109
-
110
-
111
-
112
-
113
-
114
-
115
-
116
-
117
-
118
-
119
-
120
-
121
-
122
-
123
-
124
-
125
-
126
-
127
-
128
-
129
-
130
-
131
-
132
-
133
-
134
-
135
-
136
-
137
-
138
-
139
-
140
-
141
-
142
-
143
-
144
-
145
-
146
-
147
-
148
-
149
-
150
-
151
-
152
-
153
-
154
-
155
-
156
-
157
-
158
-
159
-
160
-
161
-
162
-
163
-
164
-
165
-
166
-
167
-
168
-
169
-
170
-
171
-
172
-
173
-
174
-
175
-
176
-
177
-
178
-
179
-
180
-
181
-
182
-
183
-
184
-
185
-
186
-
187
-
188
-
189
-
190
-
191
-
192
-
193
-
194
-
195
-
196
-
197
-
198
-
199
-
200
-
201
-
202
-
203
-
204
-
205
-
206
-
207
-
208
-
209
-
210
-
211
-
212
-
213
-
214
-
215
-
216
-
217
-
218
-
219
-
220
-
221
-
222
-
223
-
224
-
225
-
226
-
227
-
228
-
229
-
230
-
231
-
232
-
233
-
234
-
235
-
236
-
237
-
238
-
239
-
240
-
241
-
242
-
243
-
244
-
245
-
246
-
247
-
248
-
249
-
250
-
251
-
252
-
253
-
254
-
255
-
256
-
257
-
258
-
259
-
260
-
261
-
262
-
263
-
264
-
265
-
266
-
267
 |
 |
16
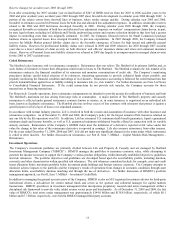
One important exposure to equity risk relates to the potential for lower earnings associated with certain of our Life businesses, such as
variable annuities, where fee income is earned based upon the fair value of the assets under management. The decline in equity markets
over the last two years has significantly reduced assets under management and related fee income during that period. In addition, certain
of our Life products offer guaranteed benefits which increase our potential obligation and statutory capital exposure should equity
markets decline. Due to declines in equity markets, our liability for these guaranteed benefits has significantly increased and our
statutory capital position has decreased. Further sustained declines in equity markets may result in the need to devote significant
additional capital to support these products. We are also exposed to interest rate and equity risk based upon the discount rate and
expected long-term rate of return assumptions associated with our pension and other post-retirement benefit obligations. Sustained
declines in long-term interest rates or equity returns are likely to have a negative effect on the funded status of these plans.
Our exposure to interest rate risk relates primarily to the market price and cash flow variability associated with changes in interest rates.
A rise in interest rates, in the absence of other countervailing changes, will increase the net unrealized loss position of our investment
portfolio and, if long-term interest rates rise dramatically within a six-to-twelve month time period, certain of our Life businesses may
be exposed to disintermediation risk. Disintermediation risk refers to the risk that our policyholders may surrender their contracts in a
rising interest rate environment, requiring us to liquidate assets in an unrealized loss position. An increase in interest rates can also
impact our tax planning strategies and in particular our ability to utilize tax benefits to offset certain previously recognized realized
capital losses. Due to the long-term nature of the liabilities associated with certain of our Life businesses, such as structured settlements
and guaranteed benefits on variable annuities, sustained declines in long-term interest rates may subject us to reinvestment risks and
increased hedging costs. In other situations, declines in interest rates or changes in credit spreads may result in reducing the duration of
certain Life liabilities, creating asset liability duration mismatches and lower spread income.
Our exposure to credit spreads primarily relates to market price and cash flow variability associated with changes in credit spreads. If
issuer credit spreads widen significantly or retain historically wide levels over an extended period of time, additional other-than-
temporary impairments and increases in the net unrealized loss position of our investment portfolio will likely result. In addition, losses
have also occurred due to the volatility in credit spreads. When credit spreads widen, we incur losses associated with the credit
derivatives where the Company assumes exposure. When credit spreads tighten, we incur losses associated with derivatives where the
Company has purchased credit protection. If credit spreads tighten significantly, the Company’ s net investment income associated with
new purchases of fixed maturities may be reduced. In addition, a reduction in market liquidity can make it difficult to value certain of
our securities when trading becomes less frequent. As such, valuations may include assumptions or estimates that may be more
susceptible to significant period-to-period changes which could have a material adverse effect on our consolidated results of operations
or financial condition.
Our statutory surplus is also affected by widening credit spreads as a result of the accounting for the assets and liabilities on our fixed
market value adjusted (“MVA”) annuities. Statutory separate account assets supporting the fixed MVA annuities are recorded at fair
value. In determining the statutory reserve for the fixed MVA annuities we are required to use current crediting rates in the U.S. and
Japanese LIBOR in Japan. In many capital market scenarios, current crediting rates in the U.S. are highly correlated with market rates
implicit in the fair value of statutory separate account assets. As a result, the change in the statutory reserve from period to period will
likely substantially offset the change in the fair value of the statutory separate account assets. However, in periods of volatile credit
markets, actual credit spreads on investment assets may increase sharply for certain sub-sectors of the overall credit market, resulting in
statutory separate account asset market value losses. As actual credit spreads are not fully reflected in current crediting rates in the U.S.
or Japanese LIBOR in Japan, the calculation of statutory reserves will not substantially offset the change in fair value of the statutory
separate account assets resulting in reductions in statutory surplus. This has resulted and may continue to result in the need to devote
significant additional capital to support the product.
Our primary foreign currency exchange risks are related to net income from foreign operations, non–U.S. dollar denominated
investments, investments in foreign subsidiaries, our yen-denominated individual fixed annuity product, and certain guaranteed benefits
associated with the Japan and U.K. variable annuities. These risks relate to potential decreases in value and income resulting from a
strengthening or weakening in foreign exchange rates versus the U.S. dollar. In general, the weakening of foreign currencies versus the
U.S. dollar will unfavorably affect net income from foreign operations, the value of non-U.S. dollar denominated investments,
investments in foreign subsidiaries and realized gains or losses on the yen denominated individual fixed annuity product. In comparison,
certain of our Life products offer guaranteed benefits which could substantially increase our potential obligation and statutory capital
exposure should the yen strengthen versus other currencies. Correspondingly, a strengthening of the U.S. dollar compared to other
currencies will increase our exposure to the U.S. variable annuity guarantee benefits where policyholders have elected to invest in
international funds.
Our real estate market exposure includes investments in commercial mortgage-backed securities (“CMBS”), residential mortgage-
backed securities (“RMBS”), commercial real estate (“CRE”) collateralized debt obligations (“CDOs”), mortgage and real estate
partnerships, and mortgage loans. The recent deterioration in the global real estate market, as evidenced by increases in property
vacancy rates, delinquencies and foreclosures, has negatively impacted property values and sources of refinancing resulting in market
illiquidity and risk premiums that reflect the current uncertainty in the real estate market. Should these trends continue, further
reductions in net investment income associated with real estate partnerships, impairments of real estate backed securities and increases
in our valuation allowance for mortgage loans may result.