The Hartford 2009 Annual Report Download - page 86
Download and view the complete annual report
Please find page 86 of the 2009 The Hartford annual report below. You can navigate through the pages in the report by either clicking on the pages listed below, or by using the keyword search tool below to find specific information within the annual report.-
 1
1 -
2
-
3
-
4
-
5
-
6
-
7
-
8
-
9
-
10
-
11
-
12
-
13
-
14
-
15
-
16
-
17
-
18
-
19
-
20
-
21
-
22
-
23
-
24
-
25
-
26
-
27
-
28
-
29
-
30
-
31
-
32
-
33
-
34
-
35
-
36
-
37
-
38
-
39
-
40
-
41
-
42
-
43
-
44
-
45
-
46
-
47
-
48
-
49
-
50
-
51
-
52
-
53
-
54
-
55
-
56
-
57
-
58
-
59
-
60
-
61
-
62
-
63
-
64
-
65
-
66
-
67
-
68
-
69
-
70
-
71
-
72
-
73
-
74
-
75
-
 76
76 -
 77
77 -
 78
78 -
 79
79 -
 80
80 -
 81
81 -
 82
82 -
 83
83 -
 84
84 -
 85
85 -
 86
86 -
 87
87 -
 88
88 -
 89
89 -
 90
90 -
 91
91 -
 92
92 -
 93
93 -
 94
94 -
 95
95 -
 96
96 -
97
-
98
-
99
-
100
-
101
-
102
-
103
-
104
-
105
-
106
-
107
-
108
-
109
-
110
-
111
-
112
-
113
-
114
-
115
-
116
-
117
-
118
-
119
-
120
-
121
-
122
-
123
-
124
-
125
-
126
-
127
-
128
-
129
-
130
-
131
-
132
-
133
-
134
-
135
-
136
-
137
-
138
-
139
-
140
-
141
-
142
-
143
-
144
-
145
-
146
-
147
-
148
-
149
-
150
-
151
-
152
-
153
-
154
-
155
-
156
-
157
-
158
-
159
-
160
-
161
-
162
-
163
-
164
-
165
-
166
-
167
-
168
-
169
-
170
-
171
-
172
-
173
-
174
-
175
-
176
-
177
-
178
-
179
-
180
-
181
-
182
-
183
-
184
-
185
-
186
-
187
-
188
-
189
-
190
-
191
-
192
-
193
-
194
-
195
-
196
-
197
-
198
-
199
-
200
-
201
-
202
-
203
-
204
-
205
-
206
-
207
-
208
-
209
-
210
-
211
-
212
-
213
-
214
-
215
-
216
-
217
-
218
-
219
-
220
-
221
-
222
-
223
-
224
-
225
-
226
-
227
-
228
-
229
-
230
-
231
-
232
-
233
-
234
-
235
-
236
-
237
-
238
-
239
-
240
-
241
-
242
-
243
-
244
-
245
-
246
-
247
-
248
-
249
-
250
-
251
-
252
-
253
-
254
-
255
-
256
-
257
-
258
-
259
-
260
-
261
-
262
-
263
-
264
-
265
-
266
-
267
 |
 |

86
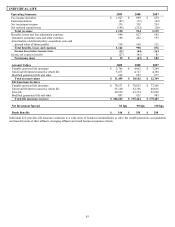
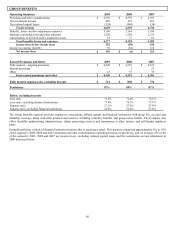
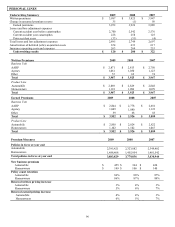
GROUP BENEFITS
Operating Summary 2009 2008 2007
Premiums and other considerations $ 4,350 $ 4,391 $4,301
Net investment income 403 419 465
Net realized capital losses (124) (540) (30)
Total revenues 4,629 4,270 4,736
Benefits, losses and loss adjustment expenses 3,196 3,144 3,109
Insurance operating costs and other expenses 1,120 1,128 1,131
Amortization of deferred policy acquisition costs 61 57 62
Total benefits, losses and expenses 4,377 4,329 4,302
Income (loss) before income taxes 252 (59) 434
Income tax expense (benefit) 59 (53) 119
Net income (loss) $ 193 $(6) $315
Earned Premiums and Other 2009 2008 2007
Fully insured – ongoing premiums $ 4,309 $ 4,355 $ 4,239
Buyout premiums — 1 27
Other 41 35 35
Total earned premiums and other $ 4,350 $4,391 $4,301
Fully insured ongoing sales, excluding buyouts $741 $ 820 $770
Persistency 87% 89% 87%
Ratios, excluding buyouts
Loss ratio 73.5% 71.6% 72.1%
Loss ratio, excluding financial institutions 77.8% 76.3% 77.3%
Expense ratio 27.1% 27.0% 27.9%
Expense ratio, excluding financial institutions 22.6% 22.4% 23.0%
The Group Benefits segment provides employers, associations, affinity groups and financial institutions with group life, accident and
disability coverage, along with other products and services, including voluntary benefits, and group retiree health. The Company also
offers disability underwriting, administration, claims processing services and reinsurance to other insurers and self-funded employer
plans.
Group Benefits has a block of financial institution business that is experience rated. This business comprised approximately 9% to 10%
of the segment’ s 2009, 2008 and 2007 premiums and other considerations (excluding buyouts) respectively, and, on average, 2% to 4%
of the segment’ s 2009, 2008 and 2007 net income (loss), excluding realized capital losses and the commission accrual adjustment in
2009 discussed below.