The Hartford 2009 Annual Report Download - page 185
Download and view the complete annual report
Please find page 185 of the 2009 The Hartford annual report below. You can navigate through the pages in the report by either clicking on the pages listed below, or by using the keyword search tool below to find specific information within the annual report.-
 1
1 -
2
-
3
-
4
-
5
-
6
-
7
-
8
-
9
-
10
-
11
-
12
-
13
-
14
-
15
-
16
-
17
-
18
-
19
-
20
-
21
-
22
-
23
-
24
-
25
-
26
-
27
-
28
-
29
-
30
-
31
-
32
-
33
-
34
-
35
-
36
-
37
-
38
-
39
-
40
-
41
-
42
-
43
-
44
-
45
-
46
-
47
-
48
-
49
-
50
-
51
-
52
-
53
-
54
-
55
-
56
-
57
-
58
-
59
-
60
-
61
-
62
-
63
-
64
-
65
-
66
-
67
-
68
-
69
-
70
-
71
-
72
-
73
-
74
-
75
-
76
-
77
-
78
-
79
-
80
-
81
-
82
-
83
-
84
-
85
-
86
-
87
-
88
-
89
-
90
-
91
-
92
-
93
-
94
-
95
-
96
-
97
-
98
-
99
-
100
-
101
-
102
-
103
-
104
-
105
-
106
-
107
-
108
-
109
-
110
-
111
-
112
-
113
-
114
-
115
-
116
-
117
-
118
-
119
-
120
-
121
-
122
-
123
-
124
-
125
-
126
-
127
-
128
-
129
-
130
-
131
-
132
-
133
-
134
-
135
-
136
-
137
-
138
-
139
-
140
-
141
-
142
-
143
-
144
-
145
-
146
-
147
-
148
-
149
-
150
-
151
-
152
-
153
-
154
-
155
-
156
-
157
-
158
-
159
-
160
-
161
-
162
-
163
-
164
-
165
-
166
-
167
-
168
-
169
-
170
-
171
-
172
-
173
-
174
-
 175
175 -
 176
176 -
 177
177 -
 178
178 -
 179
179 -
 180
180 -
 181
181 -
 182
182 -
 183
183 -
 184
184 -
 185
185 -
 186
186 -
 187
187 -
 188
188 -
 189
189 -
 190
190 -
 191
191 -
 192
192 -
 193
193 -
 194
194 -
 195
195 -
196
-
197
-
198
-
199
-
200
-
201
-
202
-
203
-
204
-
205
-
206
-
207
-
208
-
209
-
210
-
211
-
212
-
213
-
214
-
215
-
216
-
217
-
218
-
219
-
220
-
221
-
222
-
223
-
224
-
225
-
226
-
227
-
228
-
229
-
230
-
231
-
232
-
233
-
234
-
235
-
236
-
237
-
238
-
239
-
240
-
241
-
242
-
243
-
244
-
245
-
246
-
247
-
248
-
249
-
250
-
251
-
252
-
253
-
254
-
255
-
256
-
257
-
258
-
259
-
260
-
261
-
262
-
263
-
264
-
265
-
266
-
267
 |
 |

THE HARTFORD FINANCIAL SERVICES GROUP, INC.
NOTES TO CONSOLIDATED FINANCIAL STATEMENTS (continued)
F-36
5. Investments and Derivative Instruments (continued)
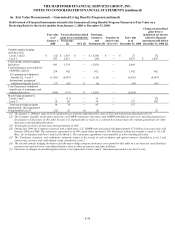
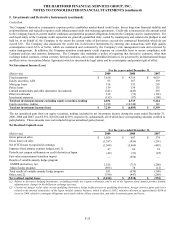
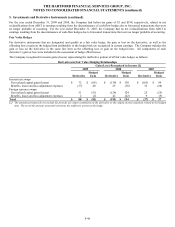
Sales of Available-for-Sale Securities
For the years ended December 31,
2009 2008 2007
Fixed maturities
Sale proceeds $ 41,973 $ 19,599 $ 21,968
Gross gains 755 511 424
Gross losses (1,272) (873) (276)
Equity securities, AFS
Sale proceeds $ 941 $ 616 $ 468
Gross gains 429 38 28
Gross losses (151) (78) (15)
Sales of AFS securities were the result of the Company’ s repositioning of its investment portfolio throughout 2009.
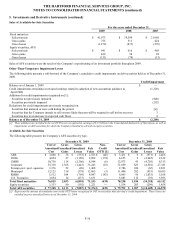
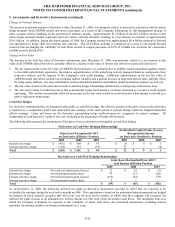
Other-Than-Temporary Impairment Losses
The following table presents a roll-forward of the Company’ s cumulative credit impairments on debt securities held as of December 31,
2009.
Credit Impairment
Balance as of January 1, 2009 $ —
Credit impairments remaining in retained earnings related to adoption of new accounting guidance in
April 2009
(1,320)
Additions for credit impairments recognized on [1]:
Securities not previously impaired (840)
Securities previously impaired (292)
Reductions for credit impairments previously recognized on:
Securities that matured or were sold during the period 245
Securities that the Company intends to sell or more likely than not will be required to sell before recovery 3
Securities due to an increase in expected cash flows 4
Balance as of December 31, 2009 $ (2,200)
[1] These additions are included in the net OTTI losses recognized in earnings of $1.5 billion in the Consolidated Statements of Operations, as well as
impairments on debt securities for which the Company intended to sell and on equity securities.
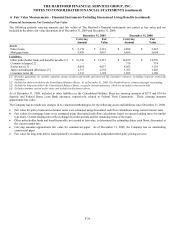
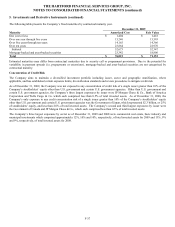
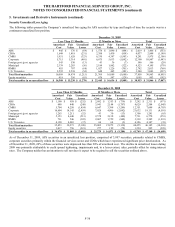
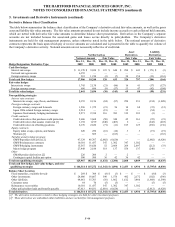
Available-for-Sale Securities
The following table presents the Company’ s AFS securities by type.
December 31, 2009 December 31, 2008
Cost or
Amortized
Cost
Gross
Unrealized
Gains
Gross
Unrealized
Losses
Fair
Value
Non-
Credit
OTTI [1]
Cost or
Amortized
Cost
Gross
Unrealized
Gains
Gross
Unrealized
Losses
Fair
Value
ABS $ 3,040 $ 36 $ (553) $ 2,523 $ (48) $ 3,431 $ 6 $ (971) $ 2,466
CDOs 4,054 27 (1,189) 2,892 (174) 4,655 2 (2,045) 2,612
CMBS 10,736 114 (2,306) 8,544 (6) 12,973 43 (4,703) 8,313
Corporate 35,318 1,368 (1,443) 35,243 (23) 31,059 623 (4,501) 27,181
Foreign govt./govt. agencies 1,376 52 (20) 1,408 — 2,786 100 (65) 2,821
Municipal 12,125 318 (378) 12,065 (3) 11,406 202 (953) 10,655
RMBS 5,512 104 (769) 4,847 (185) 6,045 96 (1,033) 5,108
U.S. Treasuries 3,854 14 (237) 3,631 — 5,883 112 (39) 5,956
Total fixed maturities 76,015 2,033 (6,895) 71,153 (439) 78,238 1,184 (14,310) 65,112
Equity securities 1,333 80 (192) 1,221 — 1,554 203 (299) 1,458
Total AFS securities $ 77,348 $ 2,113 $ (7,087) $ 72,374 $ (439) $ 79,792 $ 1,387 $ (14,609) $ 66,570
[1] Represents the amount of cumulative non-credit OTTI losses recognized in OCI on securities that also had a credit impairment. These losses are
included in gross unrealized losses as of December 31, 2009.