The Hartford 2009 Annual Report Download - page 164
Download and view the complete annual report
Please find page 164 of the 2009 The Hartford annual report below. You can navigate through the pages in the report by either clicking on the pages listed below, or by using the keyword search tool below to find specific information within the annual report.-
 1
1 -
2
-
3
-
4
-
5
-
6
-
7
-
8
-
9
-
10
-
11
-
12
-
13
-
14
-
15
-
16
-
17
-
18
-
19
-
20
-
21
-
22
-
23
-
24
-
25
-
26
-
27
-
28
-
29
-
30
-
31
-
32
-
33
-
34
-
35
-
36
-
37
-
38
-
39
-
40
-
41
-
42
-
43
-
44
-
45
-
46
-
47
-
48
-
49
-
50
-
51
-
52
-
53
-
54
-
55
-
56
-
57
-
58
-
59
-
60
-
61
-
62
-
63
-
64
-
65
-
66
-
67
-
68
-
69
-
70
-
71
-
72
-
73
-
74
-
75
-
76
-
77
-
78
-
79
-
80
-
81
-
82
-
83
-
84
-
85
-
86
-
87
-
88
-
89
-
90
-
91
-
92
-
93
-
94
-
95
-
96
-
97
-
98
-
99
-
100
-
101
-
102
-
103
-
104
-
105
-
106
-
107
-
108
-
109
-
110
-
111
-
112
-
113
-
114
-
115
-
116
-
117
-
118
-
119
-
120
-
121
-
122
-
123
-
124
-
125
-
126
-
127
-
128
-
129
-
130
-
131
-
132
-
133
-
134
-
135
-
136
-
137
-
138
-
139
-
140
-
141
-
142
-
143
-
144
-
145
-
146
-
147
-
148
-
149
-
150
-
151
-
152
-
153
-
 154
154 -
 155
155 -
 156
156 -
 157
157 -
 158
158 -
 159
159 -
 160
160 -
 161
161 -
 162
162 -
 163
163 -
 164
164 -
 165
165 -
 166
166 -
 167
167 -
 168
168 -
 169
169 -
 170
170 -
 171
171 -
 172
172 -
 173
173 -
 174
174 -
175
-
176
-
177
-
178
-
179
-
180
-
181
-
182
-
183
-
184
-
185
-
186
-
187
-
188
-
189
-
190
-
191
-
192
-
193
-
194
-
195
-
196
-
197
-
198
-
199
-
200
-
201
-
202
-
203
-
204
-
205
-
206
-
207
-
208
-
209
-
210
-
211
-
212
-
213
-
214
-
215
-
216
-
217
-
218
-
219
-
220
-
221
-
222
-
223
-
224
-
225
-
226
-
227
-
228
-
229
-
230
-
231
-
232
-
233
-
234
-
235
-
236
-
237
-
238
-
239
-
240
-
241
-
242
-
243
-
244
-
245
-
246
-
247
-
248
-
249
-
250
-
251
-
252
-
253
-
254
-
255
-
256
-
257
-
258
-
259
-
260
-
261
-
262
-
263
-
264
-
265
-
266
-
267
 |
 |

THE HARTFORD FINANCIAL SERVICES GROUP, INC.
NOTES TO CONSOLIDATED FINANCIAL STATEMENTS (continued)
F-15
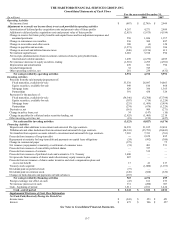
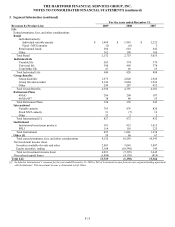
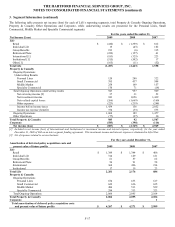
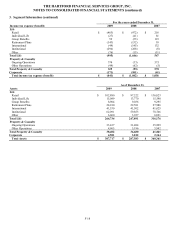
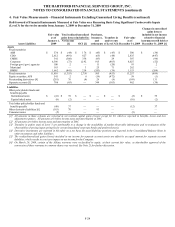
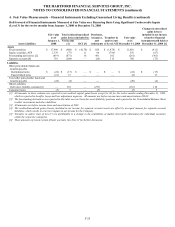
3. Segment Information (continued)
For the years ended December 31,
Revenues by Product Line 2009 2008 2007
Life
Earned premiums, fees, and other considerations
Retail
Individual annuity:
Individual variable annuity $1,468 $1,943 $2,225
Fixed / MVA annuity (2) (6) 2
Retail mutual funds 504 618 642
Other 162 198 186
Total Retail 2,132 2,753 3,055
Individual Life
Variable life 503 374 379
Universal life 390 405 374
Term/Other life 47 49 55
Total Individual Life 940 828 808
Group Benefits
Group disability 1,975 2,020 1,920
Group life and accident 2,126 2,084 1,926
Other 249 287 455
Total Group Benefits 4,350 4,391 4,301
Retirement Plans
401(k) 286 290 187
403(b)/457 38 48 55
Total Retirement Plans 324 338 242
International
Variable annuity 763 876 820
Fixed MVA annuity 31 (7) 10
Other 33 3 2
Total International [1] 827 872 832
Institutional
Institutional investment products 381 923 1,015
PPLI 114 118 223
Total Institutional 495 1,041 1,238
Other [1] 58 60 67
Total earned premiums, fees, and other considerations 9,126 10,283 10,543
Net investment income (loss)
Securities available-for-sale and other 2,903 3,045 3,497
Equity securities, trading 3,188 (10,340) 145
Total net investment income (loss) 6,091 (7,295) 3,642
Net realized capital losses (1,488) (4,138) (819)
Total Life 13,729 (1,150) 13,366
[1] Included in International’s revenues for the year ended December 31, 2009 is $68 of investment income from an inter-segment funding agreement
with Institutional. This investment income is eliminated in Life Other.