The Hartford 2009 Annual Report Download - page 88
Download and view the complete annual report
Please find page 88 of the 2009 The Hartford annual report below. You can navigate through the pages in the report by either clicking on the pages listed below, or by using the keyword search tool below to find specific information within the annual report.-
 1
1 -
2
-
3
-
4
-
5
-
6
-
7
-
8
-
9
-
10
-
11
-
12
-
13
-
14
-
15
-
16
-
17
-
18
-
19
-
20
-
21
-
22
-
23
-
24
-
25
-
26
-
27
-
28
-
29
-
30
-
31
-
32
-
33
-
34
-
35
-
36
-
37
-
38
-
39
-
40
-
41
-
42
-
43
-
44
-
45
-
46
-
47
-
48
-
49
-
50
-
51
-
52
-
53
-
54
-
55
-
56
-
57
-
58
-
59
-
60
-
61
-
62
-
63
-
64
-
65
-
66
-
67
-
68
-
69
-
70
-
71
-
72
-
73
-
74
-
75
-
76
-
77
-
 78
78 -
 79
79 -
 80
80 -
 81
81 -
 82
82 -
 83
83 -
 84
84 -
 85
85 -
 86
86 -
 87
87 -
 88
88 -
 89
89 -
 90
90 -
 91
91 -
 92
92 -
 93
93 -
 94
94 -
 95
95 -
 96
96 -
 97
97 -
 98
98 -
99
-
100
-
101
-
102
-
103
-
104
-
105
-
106
-
107
-
108
-
109
-
110
-
111
-
112
-
113
-
114
-
115
-
116
-
117
-
118
-
119
-
120
-
121
-
122
-
123
-
124
-
125
-
126
-
127
-
128
-
129
-
130
-
131
-
132
-
133
-
134
-
135
-
136
-
137
-
138
-
139
-
140
-
141
-
142
-
143
-
144
-
145
-
146
-
147
-
148
-
149
-
150
-
151
-
152
-
153
-
154
-
155
-
156
-
157
-
158
-
159
-
160
-
161
-
162
-
163
-
164
-
165
-
166
-
167
-
168
-
169
-
170
-
171
-
172
-
173
-
174
-
175
-
176
-
177
-
178
-
179
-
180
-
181
-
182
-
183
-
184
-
185
-
186
-
187
-
188
-
189
-
190
-
191
-
192
-
193
-
194
-
195
-
196
-
197
-
198
-
199
-
200
-
201
-
202
-
203
-
204
-
205
-
206
-
207
-
208
-
209
-
210
-
211
-
212
-
213
-
214
-
215
-
216
-
217
-
218
-
219
-
220
-
221
-
222
-
223
-
224
-
225
-
226
-
227
-
228
-
229
-
230
-
231
-
232
-
233
-
234
-
235
-
236
-
237
-
238
-
239
-
240
-
241
-
242
-
243
-
244
-
245
-
246
-
247
-
248
-
249
-
250
-
251
-
252
-
253
-
254
-
255
-
256
-
257
-
258
-
259
-
260
-
261
-
262
-
263
-
264
-
265
-
266
-
267
 |
 |

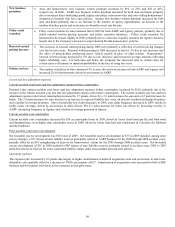
88
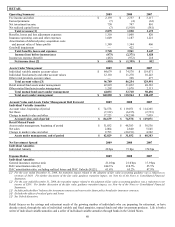
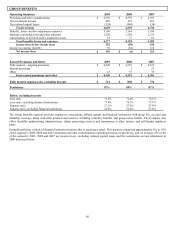
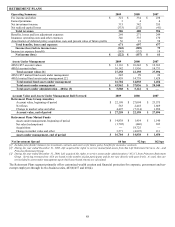
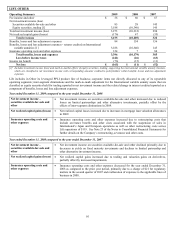
RETIREMENT PLANS
Operating Summary 2009 2008 2007
Fee income and other $ 321 $ 334 $238
Earned premiums 3 4 4
Net investment income 315 342 355
Net realized capital losses (333) (272) (41)
Total revenues 306 408 556
Benefits, losses and loss adjustment expenses 269 271 249
Insurance operating costs and other expenses 346 335 170
Amortization of deferred policy acquisition costs and present value of future profits 56 91 58
Total benefits, losses and expenses 671 697 477
Income (loss) before income taxes (365) (289) 79
Income tax expense (benefit) (143) (132) 18
Net income (loss) $ (222) $ (157) $61
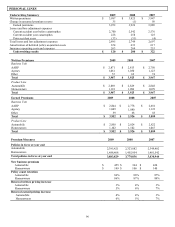
Assets Under Management
2009
2008
2007
403(b)/457 account values $ 11,116 $ 10,242 $12,363
401(k) account values 16,142 11,956 14,731
Total account values [1] 27,258 22,198 27,094
403(b)/457 mutual fund assets under management 245 99 26
401(k) mutual fund assets under management [2] 16,459 14,739 1,428
Total mutual fund assets under management 16,704 14,838 1,454
Total assets under management $ 43,962 $ 37,036 $28,548
Total assets under administration – 401(k) [3] $ 5,588 $ 5,122 $ —
Account Value and Assets Under Management Roll Forward
2009
2008
2007
Retirement Plans Group Annuities
Account value, beginning of period $ 22,198 $ 27,094 $23,575
Net flows 563 2,418 1,669
Change in market value and other 4,497 (7,314) 1,850
Account value, end of period $ 27,258 $22,198 $27,094
Retirement Plans Mutual Funds
Assets under management, beginning of period $ 14,838 $ 1,454 $1,140
Net sales/(redemptions) (1,705) (446) 103
Acquisitions — 18,725 —
Change in market value and other 3,571 (4,895) 211
Assets under management, end of period $ 16,704 $14,838 $1,454
Net Investment Spread
66 bps
92 bps
162 bps
[1] Includes policyholder balances for investment contracts and reserves for future policy benefits for insurance contracts.
[2] During the year ended December 31, 2008, Life acquired the rights to service mutual fund assets from Sun Life Retirement Services, Inc., and
Princeton Retirement Group.
[3] During the year ended December 31, 2008, Life acquired the rights to service assets under administration (“AUA”) from Princeton Retirement
Group. Servicing revenues from AUA are based on the number of plan participants and do not vary directly with asset levels. As such, they are
not included in assets under management upon which asset based returns are calculated.
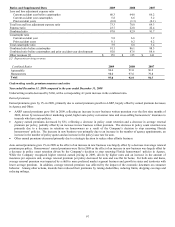
The Retirement Plans segment primarily offers customized wealth creation and financial protection for corporate, government and tax-
exempt employers through its two business units, 403(b)/457 and 401(k).