The Hartford 2009 Annual Report Download - page 19
Download and view the complete annual report
Please find page 19 of the 2009 The Hartford annual report below. You can navigate through the pages in the report by either clicking on the pages listed below, or by using the keyword search tool below to find specific information within the annual report.-
 1
1 -
2
-
3
-
4
-
5
-
6
-
7
-
8
-
 9
9 -
 10
10 -
 11
11 -
 12
12 -
 13
13 -
 14
14 -
 15
15 -
 16
16 -
 17
17 -
 18
18 -
 19
19 -
 20
20 -
 21
21 -
 22
22 -
 23
23 -
 24
24 -
 25
25 -
 26
26 -
 27
27 -
 28
28 -
 29
29 -
30
-
31
-
32
-
33
-
34
-
35
-
36
-
37
-
38
-
39
-
40
-
41
-
42
-
43
-
44
-
45
-
46
-
47
-
48
-
49
-
50
-
51
-
52
-
53
-
54
-
55
-
56
-
57
-
58
-
59
-
60
-
61
-
62
-
63
-
64
-
65
-
66
-
67
-
68
-
69
-
70
-
71
-
72
-
73
-
74
-
75
-
76
-
77
-
78
-
79
-
80
-
81
-
82
-
83
-
84
-
85
-
86
-
87
-
88
-
89
-
90
-
91
-
92
-
93
-
94
-
95
-
96
-
97
-
98
-
99
-
100
-
101
-
102
-
103
-
104
-
105
-
106
-
107
-
108
-
109
-
110
-
111
-
112
-
113
-
114
-
115
-
116
-
117
-
118
-
119
-
120
-
121
-
122
-
123
-
124
-
125
-
126
-
127
-
128
-
129
-
130
-
131
-
132
-
133
-
134
-
135
-
136
-
137
-
138
-
139
-
140
-
141
-
142
-
143
-
144
-
145
-
146
-
147
-
148
-
149
-
150
-
151
-
152
-
153
-
154
-
155
-
156
-
157
-
158
-
159
-
160
-
161
-
162
-
163
-
164
-
165
-
166
-
167
-
168
-
169
-
170
-
171
-
172
-
173
-
174
-
175
-
176
-
177
-
178
-
179
-
180
-
181
-
182
-
183
-
184
-
185
-
186
-
187
-
188
-
189
-
190
-
191
-
192
-
193
-
194
-
195
-
196
-
197
-
198
-
199
-
200
-
201
-
202
-
203
-
204
-
205
-
206
-
207
-
208
-
209
-
210
-
211
-
212
-
213
-
214
-
215
-
216
-
217
-
218
-
219
-
220
-
221
-
222
-
223
-
224
-
225
-
226
-
227
-
228
-
229
-
230
-
231
-
232
-
233
-
234
-
235
-
236
-
237
-
238
-
239
-
240
-
241
-
242
-
243
-
244
-
245
-
246
-
247
-
248
-
249
-
250
-
251
-
252
-
253
-
254
-
255
-
256
-
257
-
258
-
259
-
260
-
261
-
262
-
263
-
264
-
265
-
266
-
267
 |
 |

19
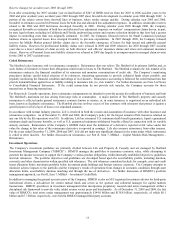
Additionally, our management considers a wide range of factors about the security issuer and uses their best judgment in evaluating the
cause of the decline in the estimated fair value of the security and in assessing the prospects for recovery. Inherent in management’ s
evaluation of the security are assumptions and estimates about the operations of the issuer and its future earnings potential.
Considerations in the impairment evaluation process include, but are not limited to:
• the length of time and the extent to which the fair value has been less than cost or amortized cost;
• changes in the financial condition, credit rating and near-term prospects of the issuer;
• whether the issuer is current on contractually obligated interest and principal payments;
• changes in the financial condition of the security’ s underlying collateral;
• the payment structure of the security;
• the potential for impairments in an entire industry sector or sub-sector;
• the potential for impairments in certain economically depressed geographic locations;
• the potential for impairments of securities where the issuer, series of issuers or industry has suffered a catastrophic type of loss or
has exhausted natural resources;
• unfavorable changes in forecasted cash flows on mortgage-backed and asset-backed securities;
• for mortgage-backed and asset-backed securities, commercial and residential property value declines that vary by property type
and location and average cumulative collateral loss rates that vary by vintage year;
• other subjective factors, including concentrations and information obtained from regulators and rating agencies;
• our intent to sell a debt or an equity security with debt-like characteristics (collectively, “debt security”) or whether it is more
likely than not that the Company will be required to sell the debt security before its anticipated recovery; and
• our intent and ability to retain an equity security without debt-like characteristics for a period of time sufficient to allow for the
recovery of its value.
During 2009, the Company recognized $1.5 billion of impairment losses in earnings. Additional impairments may be recorded in the
future, which could materially adversely affect our results and financial condition.
Losses due to nonperformance or defaults by others, including issuers of investment securities (which include structured securities
such as commercial mortgage backed securities and residential mortgage backed securities or other high yielding bonds) mortgage
loans or reinsurance and derivative instrument counterparties, could have a material adverse effect on the value of our investments,
results of operations, financial condition and cash flows.
Issuers or borrowers whose securities or loans we hold, customers, trading counterparties, counterparties under swaps and other
derivative contracts, reinsurers, clearing agents, exchanges, clearing houses and other financial intermediaries and guarantors may
default on their obligations to us due to bankruptcy, insolvency, lack of liquidity, adverse economic conditions, operational failure,
fraud, government intervention or other reasons. Such defaults could have a material adverse effect on our results of operations,
financial condition and cash flows. Additionally, the underlying assets supporting our structured securities or loans may deteriorate
causing these securities or loans to incur losses.
Our investment portfolio includes securities backed by real estate assets that have been adversely impacted due to the recent
recessionary period and the associated property value declines, resulting in a reduction in expected future cash flow for certain
securities. Additional significant property value declines and loss rates, which exceed our current estimates, as outlined in Part II, Item
7, MD&A – Investment Credit Risk – Other-Than-Temporary Impairments, could have a material adverse effect on our results of
operations, financial condition and cash flows.
The Company is not exposed to any credit concentration risk of a single issuer greater than 10% of the Company’ s stockholders’ equity
other than U.S. government and U.S. government agencies backed by the full faith and credit of the U.S. government. However, if
issuers of securities or loans we hold are acquired, merge or otherwise consolidate with other issuers of securities or loans held by the
Company, the Company’ s credit concentration risk could increase above the 10% threshold, for a period of time, until the Company is
able to sell securities to get back in compliance with the established investment credit policies.