The Hartford 2009 Annual Report Download - page 188
Download and view the complete annual report
Please find page 188 of the 2009 The Hartford annual report below. You can navigate through the pages in the report by either clicking on the pages listed below, or by using the keyword search tool below to find specific information within the annual report.-
 1
1 -
2
-
3
-
4
-
5
-
6
-
7
-
8
-
9
-
10
-
11
-
12
-
13
-
14
-
15
-
16
-
17
-
18
-
19
-
20
-
21
-
22
-
23
-
24
-
25
-
26
-
27
-
28
-
29
-
30
-
31
-
32
-
33
-
34
-
35
-
36
-
37
-
38
-
39
-
40
-
41
-
42
-
43
-
44
-
45
-
46
-
47
-
48
-
49
-
50
-
51
-
52
-
53
-
54
-
55
-
56
-
57
-
58
-
59
-
60
-
61
-
62
-
63
-
64
-
65
-
66
-
67
-
68
-
69
-
70
-
71
-
72
-
73
-
74
-
75
-
76
-
77
-
78
-
79
-
80
-
81
-
82
-
83
-
84
-
85
-
86
-
87
-
88
-
89
-
90
-
91
-
92
-
93
-
94
-
95
-
96
-
97
-
98
-
99
-
100
-
101
-
102
-
103
-
104
-
105
-
106
-
107
-
108
-
109
-
110
-
111
-
112
-
113
-
114
-
115
-
116
-
117
-
118
-
119
-
120
-
121
-
122
-
123
-
124
-
125
-
126
-
127
-
128
-
129
-
130
-
131
-
132
-
133
-
134
-
135
-
136
-
137
-
138
-
139
-
140
-
141
-
142
-
143
-
144
-
145
-
146
-
147
-
148
-
149
-
150
-
151
-
152
-
153
-
154
-
155
-
156
-
157
-
158
-
159
-
160
-
161
-
162
-
163
-
164
-
165
-
166
-
167
-
168
-
169
-
170
-
171
-
172
-
173
-
174
-
175
-
176
-
177
-
 178
178 -
 179
179 -
 180
180 -
 181
181 -
 182
182 -
 183
183 -
 184
184 -
 185
185 -
 186
186 -
 187
187 -
 188
188 -
 189
189 -
 190
190 -
 191
191 -
 192
192 -
 193
193 -
 194
194 -
 195
195 -
 196
196 -
 197
197 -
 198
198 -
199
-
200
-
201
-
202
-
203
-
204
-
205
-
206
-
207
-
208
-
209
-
210
-
211
-
212
-
213
-
214
-
215
-
216
-
217
-
218
-
219
-
220
-
221
-
222
-
223
-
224
-
225
-
226
-
227
-
228
-
229
-
230
-
231
-
232
-
233
-
234
-
235
-
236
-
237
-
238
-
239
-
240
-
241
-
242
-
243
-
244
-
245
-
246
-
247
-
248
-
249
-
250
-
251
-
252
-
253
-
254
-
255
-
256
-
257
-
258
-
259
-
260
-
261
-
262
-
263
-
264
-
265
-
266
-
267
 |
 |

THE HARTFORD FINANCIAL SERVICES GROUP, INC.
NOTES TO CONSOLIDATED FINANCIAL STATEMENTS (continued)
F-39
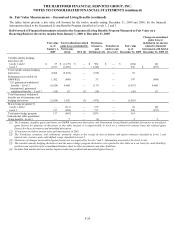
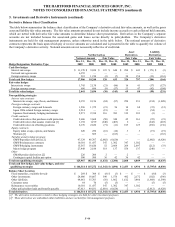
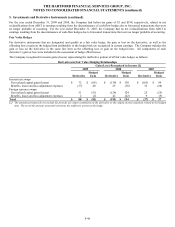
5. Investments and Derivative Instruments (continued)
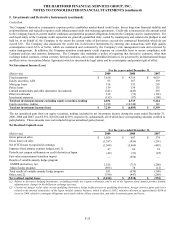
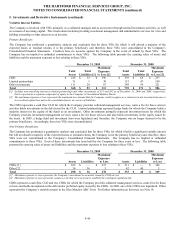
Mortgage Loans
December 31, 2009 December 31, 2008
Amortized
Cost [1]
Valuation
Allowance
Carrying
Value
Amortized
Cost [1]
Valuation
Allowance
Carrying
Value
Agricultural $ 604 $ (8) $ 596 $ 646 $ (11) $ 635
Commercial 5,492 (358) 5,134 5,849 (15) 5,834
Residential [2] 208 — 208 — — —
Total mortgage loans $ 6,304 $ (366) $ 5,938 $ 6,495 $ (26) $ 6,469
[1] Amortized cost represents carrying value prior to valuation allowances, if any.
[2] Represents residential mortgage loans held at Federal Trust Corporation, a company The Hartford acquired in June 2009. For further
information on Federal Trust Corporation, see Note 22.
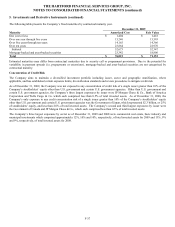
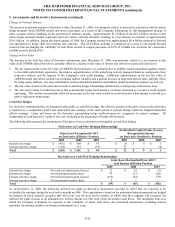
The following table presents the activity within the Company’ s valuation allowance for mortgage loans. Included in the 2009 Additions
are valuation allowances of $98 on mortgage loans held for sale, which have a carrying value of $209 and are included in mortgage
loans in the Company’ s Consolidated Balance Sheet as of December 31, 2009.
2009 2008
Balance as of January 1 $ (26) $ —
Additions (408) (26)
Deductions 68 —
Balance as of December 31 $ (366) $ (26)
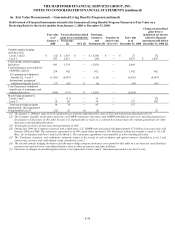
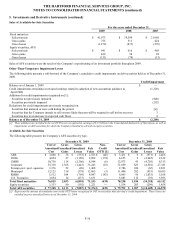
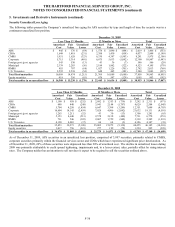
Mortgage Loans by Region
December 31, 2009 December 31, 2008
Carrying
Value
Percent of
Total
Carrying
Value
Percent of
Total
East North Central $ 125 2.1% $ 162 2.5%
Middle Atlantic 689 11.6% 825 12.8%
Mountain 138 2.3% 223 3.4%
New England 449 7.6% 487 7.5%
Pacific 1,377 23.2% 1,495 23.1%
South Atlantic [1] 1,213 20.4% 1,102 17.0%
West North Central 51 0.9% 64 1.0%
West South Central 297 5.0% 333 5.2%
Other [2] 1,599 26.9% 1,778 27.5%
Total mortgage loans $ 5,938 100.0% $ 6,469 100.0%
[1] Includes mortgage loans held at Federal Trust Corporation as of December 31, 2009.
[2] Primarily represents multi-regional properties.
Mortgage Loans by Property Type
December 31, 2009 December 31, 2008
Carrying
Value
Percent of
Total
Carrying
Value
Percent of
Total
Agricultural $ 596 10.0% $ 635 9.8%
Industrial 1,068 18.0% 1,118 17.3%
Lodging 421 7.1% 483 7.5%
Multifamily 835 14.1% 1,131 17.5%
Office 1,727 29.1% 1,885 29.1%
Residential 208 3.5% — —
Retail 712 12.0% 858 13.3%
Other 371 6.2% 359 5.5%
Total mortgage loans $ 5,938 100.0% $ 6,469 100.0%