The Hartford 2009 Annual Report Download - page 199
Download and view the complete annual report
Please find page 199 of the 2009 The Hartford annual report below. You can navigate through the pages in the report by either clicking on the pages listed below, or by using the keyword search tool below to find specific information within the annual report.-
 1
1 -
2
-
3
-
4
-
5
-
6
-
7
-
8
-
9
-
10
-
11
-
12
-
13
-
14
-
15
-
16
-
17
-
18
-
19
-
20
-
21
-
22
-
23
-
24
-
25
-
26
-
27
-
28
-
29
-
30
-
31
-
32
-
33
-
34
-
35
-
36
-
37
-
38
-
39
-
40
-
41
-
42
-
43
-
44
-
45
-
46
-
47
-
48
-
49
-
50
-
51
-
52
-
53
-
54
-
55
-
56
-
57
-
58
-
59
-
60
-
61
-
62
-
63
-
64
-
65
-
66
-
67
-
68
-
69
-
70
-
71
-
72
-
73
-
74
-
75
-
76
-
77
-
78
-
79
-
80
-
81
-
82
-
83
-
84
-
85
-
86
-
87
-
88
-
89
-
90
-
91
-
92
-
93
-
94
-
95
-
96
-
97
-
98
-
99
-
100
-
101
-
102
-
103
-
104
-
105
-
106
-
107
-
108
-
109
-
110
-
111
-
112
-
113
-
114
-
115
-
116
-
117
-
118
-
119
-
120
-
121
-
122
-
123
-
124
-
125
-
126
-
127
-
128
-
129
-
130
-
131
-
132
-
133
-
134
-
135
-
136
-
137
-
138
-
139
-
140
-
141
-
142
-
143
-
144
-
145
-
146
-
147
-
148
-
149
-
150
-
151
-
152
-
153
-
154
-
155
-
156
-
157
-
158
-
159
-
160
-
161
-
162
-
163
-
164
-
165
-
166
-
167
-
168
-
169
-
170
-
171
-
172
-
173
-
174
-
175
-
176
-
177
-
178
-
179
-
180
-
181
-
182
-
183
-
184
-
185
-
186
-
187
-
188
-
 189
189 -
 190
190 -
 191
191 -
 192
192 -
 193
193 -
 194
194 -
 195
195 -
 196
196 -
 197
197 -
 198
198 -
 199
199 -
 200
200 -
 201
201 -
 202
202 -
 203
203 -
 204
204 -
 205
205 -
 206
206 -
 207
207 -
 208
208 -
 209
209 -
210
-
211
-
212
-
213
-
214
-
215
-
216
-
217
-
218
-
219
-
220
-
221
-
222
-
223
-
224
-
225
-
226
-
227
-
228
-
229
-
230
-
231
-
232
-
233
-
234
-
235
-
236
-
237
-
238
-
239
-
240
-
241
-
242
-
243
-
244
-
245
-
246
-
247
-
248
-
249
-
250
-
251
-
252
-
253
-
254
-
255
-
256
-
257
-
258
-
259
-
260
-
261
-
262
-
263
-
264
-
265
-
266
-
267
 |
 |

THE HARTFORD FINANCIAL SERVICES GROUP, INC.
NOTES TO CONSOLIDATED FINANCIAL STATEMENTS (continued)
F-50
5. Investments and Derivative Instruments (continued)
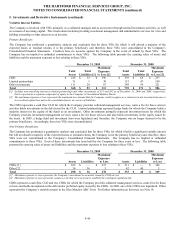
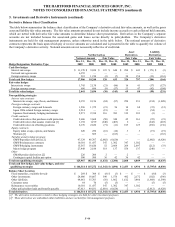
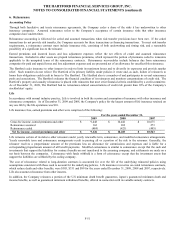
Securities Lending and Collateral Arrangements
The Company participates in securities lending programs to generate additional income. Through these programs, certain domestic
fixed income securities are loaned from the Company’ s portfolio to qualifying third-party borrowers in return for collateral in the form
of cash or U.S. Treasuries. Borrowers of these securities provide collateral of 102% of the fair value of the loaned securities at the time
of the loan and can return the securities to the Company for cash at varying maturity dates. The fair value of the loaned securities is
monitored and additional collateral is obtained if the fair value of the collateral falls below 100% of the fair value of the loaned
securities. As of December 31, 2009 and 2008, under terms of securities lending programs, the fair value of loaned securities was
approximately $45 and $2.9 billion, respectively and the associated collateral held was $46, and $3.0 billion, respectively. The decrease
in both the fair value of loaned securities and the associated collateral is attributable to the maturation of the loans in the term lending
portion of the securities lending program in 2009. The Company earns income from the cash collateral or receives a fee from the
borrower. The Company recorded before-tax income from securities lending transactions, net of lending fees, of $24 and $28 for the
years ended December 31, 2009 and 2008, respectively, which was included in net investment income.
The Company enters into various collateral arrangements in connection with its derivative instruments, which require both the pledging
and accepting of collateral. As of December 31, 2009 and 2008, collateral pledged having a fair value of $818 and $1.0 billion,
respectively, was included in fixed maturities in the Consolidated Balance Sheets.
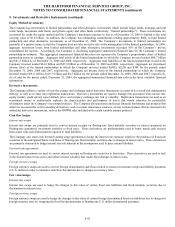
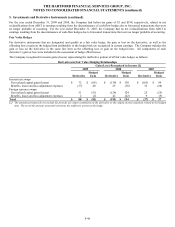
From time to time, the Company enters into secured borrowing arrangements as a means to increase net investment income. The
Company received cash collateral of $42 and $89 as of December 31, 2009 and 2008, respectively.
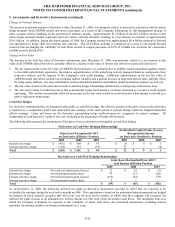
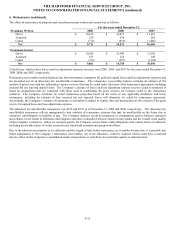
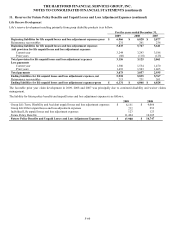
The following table presents the classification and carrying amount of loaned securities and derivative instruments collateral pledged.
December 31,
2009
December 31,
2008
Fixed maturities $ 891 $ 3,263
Equity securities, AFS — 10
Short-term investments 14 618
Total loaned securities and collateral pledged $ 905 $ 3,891
As of December 31, 2009 and 2008, the Company had accepted collateral with a fair value of $1.0 billion and $6.9 billion, respectively,
of which $931 and $6.3 billion, respectively, was cash collateral which was invested and recorded in the Consolidated Balance Sheets in
fixed maturities and short-term investments with a corresponding amount predominately recorded in other liabilities. Included in this
cash collateral was $888 and $3.4 billion for derivative cash collateral as of December 31, 2009 and 2008, respectively. The Company
offsets the fair value amounts, income accruals and cash collateral held related to derivative instruments, as discussed above in the
“Significant Derivative Instruments Accounting Policies” section and accordingly a portion of the liability associated with the derivative
cash collateral was reclassed out of other liabilities and into other assets of $149 and $574 as of December 31, 2009 and 2008,
respectively. The Company is only permitted by contract to sell or repledge the noncash collateral in the event of a default by the
counterparty. As of December 31, 2009 and 2008, noncash collateral accepted was held in separate custodial accounts and were not
included in the Company’ s Consolidated Balance Sheets.
Securities on Deposit with States
The Company is required by law to deposit securities with government agencies in states where it conducts business. As of December
31, 2009 and 2008, the fair value of securities on deposit was approximately $1.4 billion and $1.3 billion, respectively.