The Hartford 2009 Annual Report Download - page 32
Download and view the complete annual report
Please find page 32 of the 2009 The Hartford annual report below. You can navigate through the pages in the report by either clicking on the pages listed below, or by using the keyword search tool below to find specific information within the annual report.-
 1
1 -
2
-
3
-
4
-
5
-
6
-
7
-
8
-
9
-
10
-
11
-
12
-
13
-
14
-
15
-
16
-
17
-
18
-
19
-
20
-
21
-
 22
22 -
 23
23 -
 24
24 -
 25
25 -
 26
26 -
 27
27 -
 28
28 -
 29
29 -
 30
30 -
 31
31 -
 32
32 -
 33
33 -
 34
34 -
 35
35 -
 36
36 -
 37
37 -
 38
38 -
 39
39 -
 40
40 -
 41
41 -
 42
42 -
43
-
44
-
45
-
46
-
47
-
48
-
49
-
50
-
51
-
52
-
53
-
54
-
55
-
56
-
57
-
58
-
59
-
60
-
61
-
62
-
63
-
64
-
65
-
66
-
67
-
68
-
69
-
70
-
71
-
72
-
73
-
74
-
75
-
76
-
77
-
78
-
79
-
80
-
81
-
82
-
83
-
84
-
85
-
86
-
87
-
88
-
89
-
90
-
91
-
92
-
93
-
94
-
95
-
96
-
97
-
98
-
99
-
100
-
101
-
102
-
103
-
104
-
105
-
106
-
107
-
108
-
109
-
110
-
111
-
112
-
113
-
114
-
115
-
116
-
117
-
118
-
119
-
120
-
121
-
122
-
123
-
124
-
125
-
126
-
127
-
128
-
129
-
130
-
131
-
132
-
133
-
134
-
135
-
136
-
137
-
138
-
139
-
140
-
141
-
142
-
143
-
144
-
145
-
146
-
147
-
148
-
149
-
150
-
151
-
152
-
153
-
154
-
155
-
156
-
157
-
158
-
159
-
160
-
161
-
162
-
163
-
164
-
165
-
166
-
167
-
168
-
169
-
170
-
171
-
172
-
173
-
174
-
175
-
176
-
177
-
178
-
179
-
180
-
181
-
182
-
183
-
184
-
185
-
186
-
187
-
188
-
189
-
190
-
191
-
192
-
193
-
194
-
195
-
196
-
197
-
198
-
199
-
200
-
201
-
202
-
203
-
204
-
205
-
206
-
207
-
208
-
209
-
210
-
211
-
212
-
213
-
214
-
215
-
216
-
217
-
218
-
219
-
220
-
221
-
222
-
223
-
224
-
225
-
226
-
227
-
228
-
229
-
230
-
231
-
232
-
233
-
234
-
235
-
236
-
237
-
238
-
239
-
240
-
241
-
242
-
243
-
244
-
245
-
246
-
247
-
248
-
249
-
250
-
251
-
252
-
253
-
254
-
255
-
256
-
257
-
258
-
259
-
260
-
261
-
262
-
263
-
264
-
265
-
266
-
267
 |
 |

32
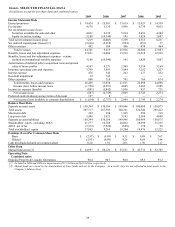
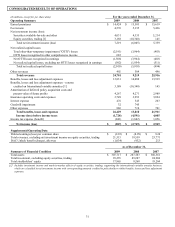
Net Income (Loss) by Operation and Life Segment
2009 2008 2007
Increase
(Decrease) From
2008 to 2009
Increase
(Decrease) From
2007 to 2008
Life
Retail $(410) $(1,399) $ 812 $ 989 $ (2,211)
Individual Life 15 (43) 182 58 (225)
Group Benefits 193 (6) 315 199 (321)
Retirement Plans (222) (157) 61 (65) (218)
International (183) (325) 223 142 (548)
Institutional (515) (502) 17 (13) (519)
Other (165) (11) (52) (154) 41
Total Life (1,287) (2,443) 1,558 1,156 (4,001)
Property & Casualty
Ongoing Operations
Underwriting results
Personal Lines 120 280 322 (160) (42)
Small Commercial 395 437 508 (42) (71)
Middle Market 258 169 157 89 12
Specialty Commercial 170 71 (18) 99 89
Ongoing Operations underwriting results 943 957 969 (14) (12)
Net servicing income [1] 37 31 52 6 (21)
Net investment income 943 1,056 1,439 (113) (383)
Net realized capital losses (266) (1,669) (160) 1,403 (1,509)
Other expenses (223) (219) (248) (4) 29
Income before income taxes 1,434 156 2,052 1,278 (1,896)
Income tax expense (benefit) 374 (33) 575 407 (608)
Ongoing Operations 1,060 189 1,477 871 (1,288)
Other Operations (77) (97) 30 20 (127)
Total Property & Casualty 983 92 1,507 891 (1,415)
Corporate (583) (398) (116) (185) (282)
Net income (loss) $(887) $(2,749) $ 2,949 $ 1,862 $ (5,698)
[1] Net of expenses related to service business.
Year ended December 31, 2009 compared to the year ended December 31, 2008
Consolidated net loss decreased primarily due to the following:
• A decrease in net realized losses, which included other-than-temporary impairments of $1.5 billion compared to $4.0 billion in
2009 and 2008, respectively, and gains on the variable annuity hedge program of $631 in 2009 compared to losses of $639 in 2008.
Partially offsetting the decrease in realized losses was approximately $300 in net realized capital losses in 2009 related to the
settlement of a contingent obligation to Allianz SE (“Allianz”).
• Goodwill impairments in 2009 were $32, after-tax, recorded in Corporate compared to $597, after-tax, in 2008 with $323, after-tax,
recorded in Corporate and $274, after-tax, recorded in Life.
Excluding net realized capital losses and goodwill impairments, Life operations earnings decreased approximately $300 and Property &
Casualty operations earnings decreased approximately $150 from 2008 to 2009. See the segment sections of the MD&A for a
discussion on the respective operations’ performance.
Year ended December 31, 2008 compared to the year ended December 31, 2007
The change from consolidated net income to consolidated net loss was primarily due to the following:
• Net realized losses of $5.9 billion in 2008 compared to $994 in 2007, which included other-than-temporary impairments of $4.0
billion in 2008 and $483 in 2007.
• DAC Unlock, after-tax, impact to earnings was a charge of $932 in 2008 compared to a benefit of $213 in 2007.
• Goodwill impairments in 2008 were $597, after-tax, with $323, after-tax, recorded in Corporate and $274, after-tax, in Life
compared to no goodwill impairments recorded in 2007.
Excluding net realized capital losses, goodwill impairments and DAC Unlocks, Life operations earnings decreased approximately $500
and Property & Casualty operations earnings decreased approximately $300 from 2007 to 2008. See the segment sections of the
MD&A for a discussion on the respective operations’ performance.